
London Ferrell Community Garden
Locations of Lexington’s community gardens. Gardens maintained by Seedleaf: Nourishing communities by growing, cooking, sharing, and recycling food.
London Ferrell Community Garden
Locations of Lexington’s community gardens. Gardens maintained by Seedleaf: Nourishing communities by growing, cooking, sharing, and recycling food.

After the successful release of our new edition of the Red River Gorge Backpacking Guide last May, we’re now deep into making a comprehensive map of the Sheltowee Trace.
This is our most ambitious mapping and publishing project yet. We’re showing the entire 282 miles of foot, equestrian, and multiuse trail at 1:32,000 scale…that’s 1 inch to a 1/2 mile. So in this publication, you’ll be able to hold the full Trace in your hands…all 12 feet of it.
Let’s think of it a different way. To show this trail adequately, we’re designing and printing over 24 sq. ft. of map at full-color. That’s equivalent to making a 4×6 foot map that labels every stream, destination, and trail. This is a generous allotment of time and paper, but the trail’s incredible beauty and future deserve it. The Sheltowee is Kentucky longest hiking trail and frankly certain parts need to be used more by hikers.
Like our other maps, the Trace map will be a fine navigation tool. We’re dropping in latitude/longitude grids for GPS navigation, mile markers for the Trace that have been meticulously measured, 50-ft topographic elevation contours, canopy cover, and connecting trails and trailheads.
We’ll release the South edition for the Woodland Park Art Fair this August, with the North edition following shortly after. Each edition will have same format: an overview map that gets you to the major trailheads and the topographic trail maps. The image on the left shows a draft of the overview map. To the general layout of the detailed maps, visit here (note these do not show any text yet, just a preview of how we’re gonna make the Sheltowee).
The Trace is a 286-mile National Recreation Trail that connects recreation areas in the Daniel Boone National Forest, Big South Fork, Cumberland Falls, and Natural Bridge State Park.
As a lover of the atmosphere and sun, I want to see how light and sky change over the course of the day. I also want to see how large-area weather events, such as the passage of a front, impact different places in the Great Smoky mountains. The inspiration behind this page was a desire to record weather changes at different elevations on a mountain and to help the photographer in me better understand a secretive and dynamic landscape.
Enter Yesterday: a site of prior-day animations of federal web cams and satellite imagery located here at http://www.outragegis.com/weather/img/animation/yesterday. Note this page always shows conditions for the prior day since they are full-day timelines.
The Great Smokies have about one mile of vertical relief and weather conditions can be dramatically different depending on your elevation. Whatever it’s a line of thunderstorms or fog in the valleys on a calm morning, this is a visual record of evolving conditions…only of course it happens during daylight. For the weather nut who likes to take it a step further, the page gives data from park’s 5 weather stations for the same day….and it’s all archived.
How was it done? After tinkering with ImageMagick and FFmpeg, I made a script that creates full-day animations of the webcams in the Great Smokies and visible satellite images from NOAA. What will it become? Consider it a visual archive of the atmosphere and movements of the Sun in the Great Smokies. Any suggestions are welcome.
Some notes for updates: I haven’t fully utilized the flash embedded video (see the two samples below, top is animated gif and below is embedded flash video). The problem is setting animations in sync together, e.g., sun rises at the same time in all movies. With an animated .gif, I think you simply need to refresh your browser after all of the images are loaded to get a partial sync. A better solution is out there. I can also increase the sampling rate for smoother play; now it’s two samples an hour.

Weather map and webcam animation for the Great Smokies
[flv:http://www.outragegis.com/weather/img/animation/090603/PurchaseKnob.flv 400 290]
These are also archived, so if you go to the smokies for a backcountry trip, you’ll be able to find your days here.

![]()
![]() So the month of May is nearly done and with it, ends the month-long celebration of the bike and human-powered travel. As a hiker, I often worry about my environmental impact during a drive to a favorite trailhead.
So the month of May is nearly done and with it, ends the month-long celebration of the bike and human-powered travel. As a hiker, I often worry about my environmental impact during a drive to a favorite trailhead.
How can I minimize fuel consumption and make better? I reason that if I bike as my primary form of transportation, I will only need to drive during my trips to the woods. This works great if I have a network of safe and continuous bike lanes and trails in the city. Enter Bike Lexington.
I’m proud to say that I contributed a small share to bike community here. I took the artwork designed by Cricket Press (shown by the poster design left) and made the Bike Lexington interactive calendar (shown here), which hopefully encourages people to bike more. Building the site definitely exposed me to vibrant groups and events that helped me stay committed to biking in Lexington.
After this month is over though, biking doesn’t stop. Check out the website for new events throughout the year or join the newsletter subscription to stay updated.


 Cumberland Gap Map
Distance: 16 Miles round-trip from the Civic Park trailhead at Ewing
Difficulty: +++
Scenic Views: ++++
Elevation Relief: 2,000ft ^^
Ownership: Cumberland Gap, NPS
| Cumberland Gap Trail Map: $14 |  |
![]()
![]() Camp Hensley
Camp Hensley
The Pixel Team hiked up to Hensley Settlement after the Southeastern Foot Trails Conference and it was a fantastic, sublime experience. Sherman Hensley hiked up this mountain in 1903 with his pregnant wife and all of the tools and livestock they could drive. They saw a large, flat expanse on the mountain summit and carved out a pioneer homestead. Two backcountry camps are within 0.5 miles of this historic community.
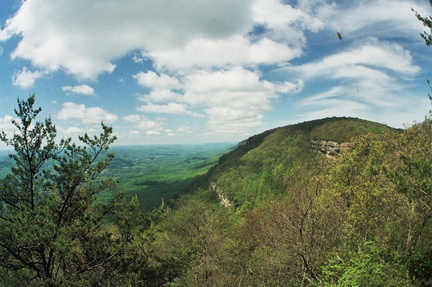 Ridge Trail overlook
Spring is typically a wet month. However over the past week, Eastern Kentucky has experienced unusual rainfall amounts. The record for the month is 10.78 inches in 2004; and no other year has been above 10 inches for May. The only year that saw over 9 inches of rainfall for May was in 1995. May during 1983 and 1984 were the only times over 7 inches of rainfall.
From the National Weather Service in Jackson, Kentucky:
"2 TO 5 INCHES OF RAIN HAS FALLEN ACROSS EASTERN KENTUCKY DURING THE
MONTH OF MAY. THIS IS OF INTEREST...SINCE WE ARE ONLY ABOUT ONE
QUARTER OF THE WAY THROUGH THE MONTH. HEAVY RAINFALL IS VERY
POSSIBLE AS WE HEAD INTO MOTHERS DAY WEEKEND AND COULD PUSH RAINFALL
AMOUNTS UP ANOTHER INCH OR TWO.

THE AVERAGE PRECIPITATION FOR THE MONTH OF MAY AT THE JACKSON
WEATHER OFFICE IS 4.92 INCHES. WE HAVE ALL READY RECORDED 4.12
INCHES OF RAINFALL AS OF THIS MORNING AT 7AM. IT IS TOO EARLY TO TELL
...BUT WE ARE CERTAINLY ON TRACK TO HAVE ONE OF THE RAINIEST MAYS
EVER. THE RAINIEST MAY OCCURRED IN 2004 WHEN THE JACKSON WEATHER
OFFICE RECORDED 10.78 INCHES FOR THE MONTH. THIS WAS THE ONLY MONTH
OF MAY THAT OVER TEN INCHES OF RAIN FELL. MAY OF 1995 HAD 9.91
INCHES AND WAS THE ONLY MONTH WITH OVER 9 INCHES RECORDED. THE NEXT
HIGHEST TOTALS WERE OVER 7 INCHES AND THAT OCCURRED IN ONLY TWO
YEARS...1983 AND 1984.

HERE ARE RAINFALL TOTALS FROM EASTERN KENTUCKY COOPERATIVE WEATHER
STATIONS AND AUTOMATED SURFACE OBSERVING SYSTEMS AS OF 7 AM
EDT...FOR THE MONTH OF MAY 2009.
LOCATIONÂ Â Â Â Â Â Â Â /Â Â COUNTYÂ Â Â Â /Â Â Â Â PRECIPITATION
BARBOURVILLEÂ Â Â Â Â Â Â Â KNOXÂ Â Â Â Â Â Â Â Â Â Â Â Â 4.38Â INCHES BAXTERÂ Â Â Â Â Â Â Â Â Â Â Â Â Â HARLANÂ Â Â Â Â Â Â Â Â Â Â 3.85Â INCHES BEATTYVILLE 4NÂ Â Â Â Â Â LEEÂ Â Â Â Â Â Â Â Â Â Â Â Â Â 3.68Â INCHES BIG SHELBYÂ Â Â Â Â Â Â Â Â Â PIKEÂ Â Â Â Â Â Â Â Â Â Â Â Â 3.01Â INCHES BOONEVILLE 1SEÂ Â Â Â Â Â OWSLEYÂ Â Â Â Â Â Â Â Â Â Â 4.49Â INCHES BUCKHORN LAKEÂ Â Â Â Â Â Â PERRYÂ Â Â Â Â Â Â Â Â Â Â Â 2.80Â INCHES CARR CREEK LAKEÂ Â Â Â Â KNOTTÂ Â Â Â Â Â Â Â Â Â Â Â 2.73Â INCHES CAVE RUN LAKEÂ Â Â Â Â Â Â ROWANÂ Â Â Â Â Â Â Â Â Â Â Â 2.28Â INCHES CLAY CITY 1WNWÂ Â Â Â Â Â POWELLÂ Â Â Â Â Â Â Â Â Â Â 2.77Â INCHES CLOSPLINT 4ESEÂ Â Â Â Â Â HARLANÂ Â Â Â Â Â Â Â Â Â Â 4.55Â INCHES COLOÂ Â Â Â Â Â Â Â Â Â Â Â Â Â Â Â PULASKIÂ Â Â Â Â Â Â Â Â Â 3.98Â INCHES CRESSYÂ Â Â Â Â Â Â Â Â Â Â Â Â Â ESTILLÂ Â Â Â Â Â Â Â Â Â Â 2.59Â INCHES DRAFFINÂ Â Â Â Â Â Â Â Â Â Â Â Â PIKEÂ Â Â Â Â Â Â Â Â Â Â Â Â 3.54Â INCHES EZELÂ Â Â Â Â Â Â Â Â Â Â Â Â Â Â Â MORGANÂ Â Â Â Â Â Â Â Â Â Â 3.31Â INCHES GIMLETÂ Â Â Â Â Â Â Â Â Â Â Â Â Â ELLIOTTÂ Â Â Â Â Â Â Â Â Â 2.60Â INCHES HARLAN 1SÂ Â Â Â Â Â Â Â Â Â Â HARLANÂ Â Â Â Â Â Â Â Â Â Â 3.80Â INCHES HARLAN STATE POLICEÂ HARLANÂ Â Â Â Â Â Â Â Â Â Â 2.95Â INCHES HAZARD WATERÂ Â Â Â Â Â Â Â PERRYÂ Â Â Â Â Â Â Â Â Â Â Â 3.71Â INCHES HAZARDÂ Â Â Â Â Â Â Â Â Â Â Â Â Â PERRYÂ Â Â Â Â Â Â Â Â Â Â Â 3.70Â INCHES HAZARD STATE POLICEÂ PERRYÂ Â Â Â Â Â Â Â Â Â Â Â 2.95Â INCHES HEIDELBERG 2NÂ Â Â Â Â Â Â LEEÂ Â Â Â Â Â Â Â Â Â Â Â Â Â 4.05Â INCHES BAXTERÂ Â Â Â Â Â Â Â Â Â Â Â Â Â HARLANÂ Â Â Â Â Â Â Â Â Â Â 3.85Â INCHES INEZ 2EÂ Â Â Â Â Â Â Â Â Â Â Â Â MARTINÂ Â Â Â Â Â Â Â Â Â Â 3.78Â INCHES ISLAND CITYÂ Â Â Â Â Â Â Â Â OWSLEYÂ Â Â Â Â Â Â Â Â Â Â 5.16Â INCHES IVELÂ Â Â Â Â Â Â Â Â Â Â Â Â Â Â Â FLOYDÂ Â Â Â Â Â Â Â Â Â Â Â 2.27Â INCHES NWS JACKSONÂ Â Â Â Â Â Â Â Â BREATHITTÂ Â Â Â Â Â Â Â 4.12Â INCHES JEREMIAH 1SÂ Â Â Â Â Â Â Â Â LETCHERÂ Â Â Â Â Â Â Â Â Â 3.11Â INCHES KINGDOM COME ST PARK HARLANÂ Â Â Â Â Â Â Â Â Â Â 3.12Â INCHES LONDON CORBIN APTÂ Â Â LAURELÂ Â Â Â Â Â Â Â Â Â Â 4.46Â INCHES MONTICELLO 3NEÂ Â Â Â Â Â WAYNEÂ Â Â Â Â Â Â Â Â Â Â Â 4.00Â INCHES MOUNT STERLING 5NÂ Â Â MONTGOMERYÂ Â Â Â Â Â Â 2.41Â INCHES MOUNT VERNONÂ Â Â Â Â Â Â Â ROCKCASTLEÂ Â Â Â Â Â Â 2.77Â INCHES ONEIDAÂ Â Â Â Â Â Â Â Â Â Â Â Â Â CLAYÂ Â Â Â Â Â Â Â Â Â Â Â Â 4.54Â INCHES PAINTSVILLE 1EÂ Â Â Â Â Â JOHNSONÂ Â Â Â Â Â Â Â Â Â 3.55Â INCHES PIKEVILLE ST POLICEÂ PIKEÂ Â Â Â Â Â Â Â Â Â Â Â Â 2.05Â INCHES PRESTONSBURG 3NWÂ Â Â Â FLOYDÂ Â Â Â Â Â Â Â Â Â Â Â 4.09Â INCHES QUICKSANDÂ Â Â Â Â Â Â Â Â Â Â BREATHITTÂ Â Â Â Â Â Â Â 3.52Â INCHES RELIEFÂ Â Â Â Â Â Â Â Â Â Â Â Â Â MORGANÂ Â Â Â Â Â Â Â Â Â Â 3.18Â INCHES ROGERSÂ Â Â Â Â Â Â Â Â Â Â Â Â Â WOLFEÂ Â Â Â Â Â Â Â Â Â Â Â 2.82Â INCHES SALYERSVILLEÂ Â Â Â Â Â Â Â MAGOFFINÂ Â Â Â Â Â Â Â Â 4.28Â INCHES SANDY HOOKÂ Â Â Â Â Â Â Â Â Â ELLIOTTÂ Â Â Â Â Â Â Â Â Â 2.67Â INCHES SKYLINEÂ Â Â Â Â Â Â Â Â Â Â Â Â LETCHERÂ Â Â Â Â Â Â Â Â Â 3.20Â INCHES SLADE 5NEÂ Â Â Â Â Â Â Â Â Â Â POWELLÂ Â Â Â Â Â Â Â Â Â Â 2.86Â INCHES SOMERSET 2NÂ Â Â Â Â Â Â Â Â PULASKIÂ Â Â Â Â Â Â Â Â Â 3.74Â INCHES STANTON 2WÂ Â Â Â Â Â Â Â Â Â POWELLÂ Â Â Â Â Â Â Â Â Â Â 2.88Â INCHES STEARNS 2SÂ Â Â Â Â Â Â Â Â Â MCCREARYÂ Â Â Â Â Â Â Â Â 5.09Â INCHES VICTORY 5NWÂ Â Â Â Â Â Â Â Â LAURELÂ Â Â Â Â Â Â Â Â Â Â 4.13Â INCHES WEST LIBERTY 3NWÂ Â Â Â MORGANÂ Â Â Â Â Â Â Â Â Â Â 2.67Â INCHES WEST LIBERTY 11NWÂ Â Â MORGANÂ Â Â Â Â Â Â Â Â Â Â 2.57Â INCHES WHITESBURGÂ Â Â Â Â Â Â Â Â Â LETCHERÂ Â Â Â Â Â Â Â Â Â 2.50Â INCHES WHITESBURG 2SEÂ Â Â Â Â Â LETCHERÂ Â Â Â Â Â Â Â Â Â 3.21Â INCHES WILLIAMSBURG 1NWÂ Â Â Â WHITLEYÂ Â Â Â Â Â Â Â Â Â 5.14Â INCHES
THE NATIONAL WEATHER SERVICE AT JACKSON WOULD LIKE TO THANK ALL THE
DEDICATED COOPERATIVE WEATHER OBSERVERS FOR THEIR TIMELY REPORTS."
The past day’s weather has included periods intense light and shadow from very low, broken stratus & cumulus clouds. Rays of love from god shine from heaven through parted clouds; and there was plenty of love in the mountains. Even in these low quality webcam images, you can see golden rays of light and clearly defined ridges. Now what if you were there with a serious camera.
Though the weather overall has been chilly and uncomfortable, it does give some memorable vistas. The more diffuse stratus clouds in the western mountains were lower in altitude and created softer light.

View from Purchase Knob
As we gear up for the Sheltowee Trace topographic map, I thought it would be interesting to see if a complete 3d map of the ST could be printed. Unfortunately, it would have to be a huge sheet of paper to get the detail necessary for a good map. But as an online viewer, I see potential. This sample is a raw render output and you can see well the basic physiography. Now we just need to add trails, transportation, labels, etc….nothing too much, just about 6,000 sq. mi. for the Daniel Boone NF.

Explore this map through a zoomable flash map
 5th Edition Red River Gorge Backpacking Map
It’s almost ready for release!
A complete remake of our popular backpacking guide with the green maps. This new set keeps all of the great features of the old maps, but in full-color and updated trails and data.
Visit our Gorge webpage to learn more: http://www.outrageGIS.com/gorge
In January we looked at the previous editions, all 2-color with an travel elevation profile booklet, and thought how we could improve it. We had used aerial photography to show landcover type, which did a good job indicating density of canopy, open areas, sunlight, and offered a rustic green background for our GPS trails.
However, most people are confused when they look at aerial photographs…they think hills are valleys and vice versa. This terrain inversion is a significant cartographic problem, but we were confident then when most people *used them in the field* they made sense.
While unique advantages exist using photographs, for the new edition we used a custom created, full-color hillshade that shows forest canopy cover type and open areas. We artificially lit the landscape from the west and eliminated terrain inversion. We added a distinct stream symbol to clearly mark drainage. With 50-foot contours and spot elevations, this new edition offers a handsome way to stay located.
Since most GPS applications are now by default in the latitude/longitude (decimal degrees) coordinate system, we added this graticule to the map. A UTM grid is also labeled. With scales on the corners of maps that can be seen while folded, a hiker can quickly determine distance and locate themselves with a GPS in either dd.dddd or UTM coordinate systems.
We still have all of the trail profiles, side trails, backcountry campsites that were in the previous edition. The new edition actually covers more area and trails.
| Red River Gorge Backpacking Map: $14 | |
 April 15, 2009. We see two very different Smokies today and the highest peaks in the southern Appalachians provide an atmospheric boundary.
On the west side of the mountains we see low dense stratus clouds, but on the east side we have clear skies. As the atmosphere is uplifted over the the highest ridge of mountains there’s cooling and abundant cloud formation. That’s half the story.
The winds are form the northwest and the Smokies (along the Tennessee/North Carolina stateline) provide the highest barrier the winds must cross over. On the leeward side, as the winds cross over the mountains, they descend, warm, and prevent cloud formation especially just east of the summits.
Link to more: http://pixel.outragegis.com/v/weather_maps/090415_TwoSmokies/
These images and animation show a textbook situation of topographic control of weather, but over a very large area.
Weather in the Smokies this spring has been very active. Just last week, Mt. LeConte had 14 inches of snow. This morning the sun rose as a golden fireball that lit the mountain ridges in clear relief. Mt LeConte is the peak at the sun’s 4 o’clock position. Over six inches of snow lingered at the highest elevations for a few days. May has given measurable snowfall.

View from Look Rock
From the National Park’s website
“Contact: Bob Miller, (865) 436-1207
In response to a growing concern about a new malady that has killed an estimated 400,000 bats in the Northeast, managers at Great Smoky Mountains National Park have closed all of its caves to public entry until further notice.
According to biologists from the U.S. Fish and Wildlife Service, a condition called White-nose Syndrome (WNS) is taking a heavy toll on bats that hibernate in caves and mines in nine states from Virginia north to New Hampshire. WNS is named for a white fungus that shows up on the faces of bats, including the endangered Indiana Bat. The Indiana bat has been recorded in the Park and is among several species of special concern relative to this disease.
The disease causes bats to come out of hibernation severely underweight to the point that they often starve before the insects on which they feed emerge in the spring. Once a colony is infected with the fungus, it spreads rapidly and may kill up to 90% of the bats within that cave in one season.
Great Smoky Mountains National Park Wildlife Biologist, Bill Stiver said, “Biologists are still uncertain about the cause of WNS in bats. However, it is believed to be transmitted from bat to bat but also may be inadvertently transported from cave to cave by humans. It has not yet arrived in Tennessee or North Carolina, so we are closing all our caves to reduce the odds of the fungus hitching a ride to our protected caves on a caver coming from a state where it is already established.â€
“The Park is closing its caves in response to a recommendation from the Fish and Wildlife Service.†Stiver continued, “That closure advice does not apply to commercial tourist caves, but Fish and Wildlife is planning on working with commercial operators to minimize potential for spread from those sources. There is no known human health risk related to WNS.â€
Park managers say that the Smokies has 17 caves and two mine complexes that are now closed under the advisory and that a permit has always been required to enter them. No permits will be issued and violators face fines of up to $5,000 or six months imprisonment.
More information on the disease and this closure is available at http://www.nps.gov/grsm/naturescience/caves.htm”
http://www.nps.gov/grsm/naturescience/caves.htm
Many customers ask us why we use aerial photography. Often it’s hard for some readers to understand because of terrain inversion. Let’s take a Q&A with a real customer:
Customer, “Hi guys. I just wonder if anyone has ever discussed with you the fact that the shading on your maps appears to be reversed. That is, the high points appear like low points and vice versa, if one is looking at the map oriented to north. If one turns the map around, so it is oriented to south, then everything looks correct. So, my guess is simply that the shading is on the wrong side of the ridges. ”
Our response, “Thanks for asking a question that has popped up a few times. In the mapping biz, it’s called terrain inversion and it is a problem sustained by tradition. Before aerial photography, most terrains were shaded as if the sun was in the upper-left corner. This was established as cartographic tradition because we read from upper-left to lower-right.
This worked fine until aerial photography became used as base maps. In the northern hemisphere, and especially at our latitude, the sun is never shines from the north. All of our shadows fall from south to north, completely opposite to how they’re depicted on most conventional maps. Cartographers in the southern hemisphere think we’re crazy up here moving the sun around to accommodate tradition at expense of reality. But they have the advantage of sun always being in the upper quadrants, thus giving the type of illumination you’re probably used to.
But we use aerial photography in most of our maps, because it is reality and at the right scale is far superior to an artificial hillshade in our opinion for couple reasons. You can see areas that are really in shadow, which indicate different plant communities. You can see canopy type, density, and other indicators for type of forest. If you’re a photographer, these images show depth and lines of shadow, helping you predict the kind of light you want for a photo. Finally, if you have take an aerial photo up high to orient, you can do so by shadows.

Detail from our Big South Fork map with aerial photography. Note the north facing cliffs are in shadow, just as in found in the wild.
So in my defense, I say it’s all about sunlight. I understand your problems and trust me, it has stirred the anger of my peers at cartography conferences. We’ve been flamed on blogs for this apparent flaw, but in our humble opinion, an aerial photo is not the problem, it’s tradition.
It’s sounds like you have a lot of experience with maps, and I respect your opinion. However, I think if you get used to aerial photography, you’ll find distinct advantages. Also in defense of tradition, I did illuminate our recent map, Trail Atlas of the Great Smokies from the NW. That map does not use aerial photography so it was an easy decision.”
 A presentation given at the 32nd annual ASA conference, March 2009. I showed planning sketches of our current project: the Sheltowee Trace Scenic Atlas. Each major trail section is defined. If you know our publishing format, you can begin to see it come together.
The atlas will have 15 full-color tiles at a primary scale of 1:32k or 1 inch to a half mile. Maps will be in full-color with landcover and canopy type and 50-ft contours.
Due for release in summer of 2009.
View the presentation here or to plan your trip visit http://www.sheltoweetrace.com
Controlled burning will impact Cades Cove through April. From the park’s website: “Fire managers at Great Smoky Mountains National Park plan to begin conducting a series of controlled burns of fields in the interior of Cades Cove on Tuesday March 24, 2009, if weather conditions permit. Park managers plan to burn three to seven different parcels totaling up to 300 acres from now until May 1.”

View from Look Rock


