How much tree canopy covers the urban service area of Lexington, Kentucky? Inspired by the Davey Resource Group’s October 2013 study of canopy cover using 2012 NAIP imagery within Lexington’s Urban Service Area, a GIS class at the University of Kentucky created a similar, though limited, evaluation. [Read more…]
Pine Mountain Canopy Tour
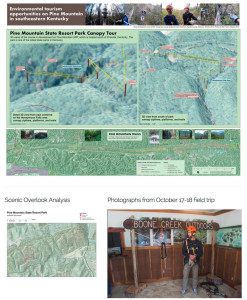
What wild weekend and mapping task! Boyd led an undergraduate GIS class at the University of Kentucky and endeavored to map and analyze environmental tourism assets on Pine Mountain. During discussions with Pine Mountain State Resort Park, we discovered a canopy zipline tour, one of the first in the state, was being installed in the park. [Read more…]
Sheltowee Trace South, 2015
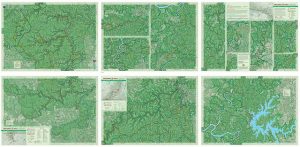
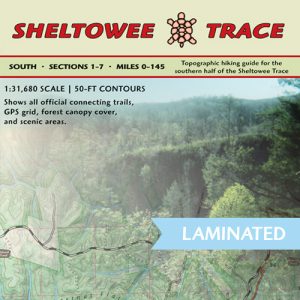
We’ve finished our Sheltowee Trace South, 2015 map. This rich color topographic trail map includes almost the entire Big South Fork National Recreation and River Area and the southern half of the Daniel Boone National Forest.
Map is six 19″ x 27″ pages and is available laminated. Check it out!
Woodland Art Fair, 2015
Come down to the Woodland Art Fair this Saturday and Sunday, Â August 15 and 16. We’ve made big progress on the Sheltowee Trace South map and we’ll have samples to show at our booth. Â While in the same format as Sheltowee Trace North map, we’re adding an additional sheet to cover the Big South Area.
The fair runs from 10 a.m. to 5 p.m., or there abouts. We’ll stay as long as you’re visiting!
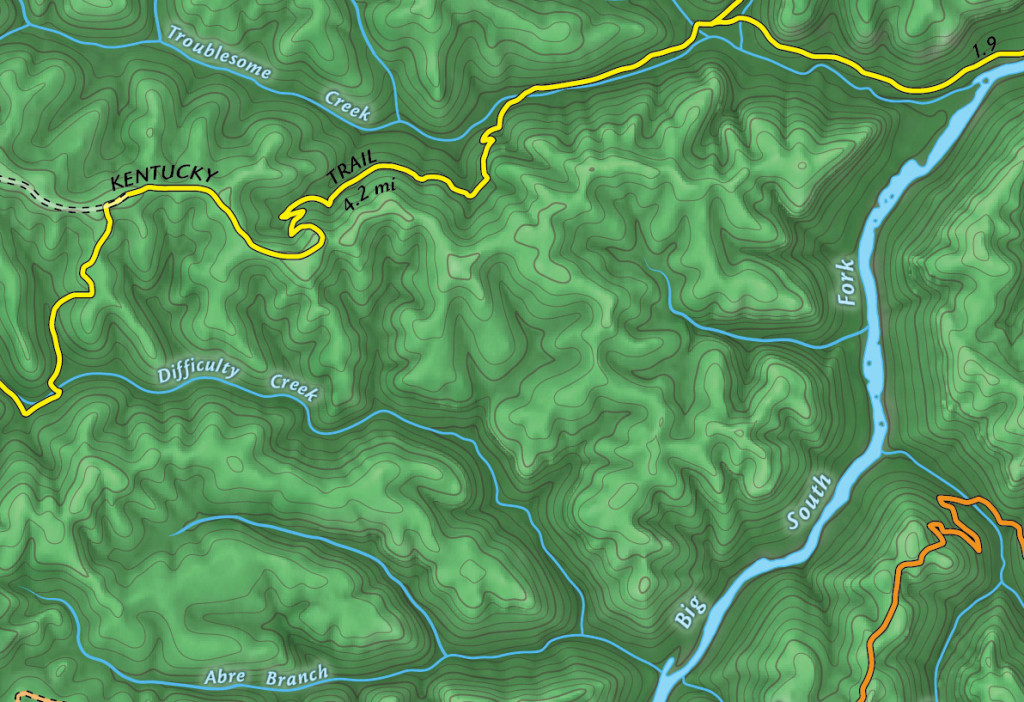
Our booth location and coordinates are shown on the below map. We’ll be between Troublesome and Difficulty Creeks, at least spirit! Find us on the Woodland Christian Church side of the fair at the shady bottom of the hill.
Robinson Forest Camp Trail Map Exercise
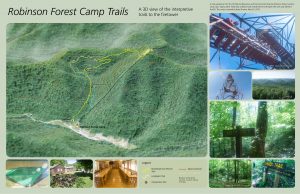
As part of UK Natural Resources and Environmental Sciences 2015 Summer Camp, I taught a one-day GPS and GIS exercise to map the interpretive trails around base camp. With seven undergraduates and their mobile devices and one Trimble ProXRS, we split into three teams. One team focused on the trail network and GPS mapped trail alignment and intersections. A second team mapped interpretive sites on the left-side of trials, while a third-team mapped right-side features.
In the second-half of the day, we worked in the classroom and on laptops to make a map in ArcGIS. Some students had GIS software experience and helped their fellow classmates to make a map as a geospatial PDF and use on their mobile devices. A GeoPDF is a mobile map that doesn’t require a cellular data connection to function.
Student Observations and Analysis of UK Campus Celebrations
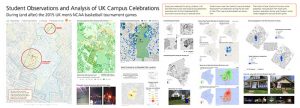
During two weekends this spring, students in UK GEO 309 (Introduction to GIS) were asked to log celebrations associated with UK men’s basketball NCAA tournament around campus in selected zones. Student teams were then tasked to map and analyze these patterns of celebrations during the last week of class. Their maps and photographs are shown here.
Their topics include: locations of campus rental properties, noise pollution from major party locations, population density, and changes in social media engagement during and after games.Â
Distress In Kentucky
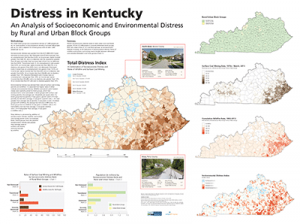
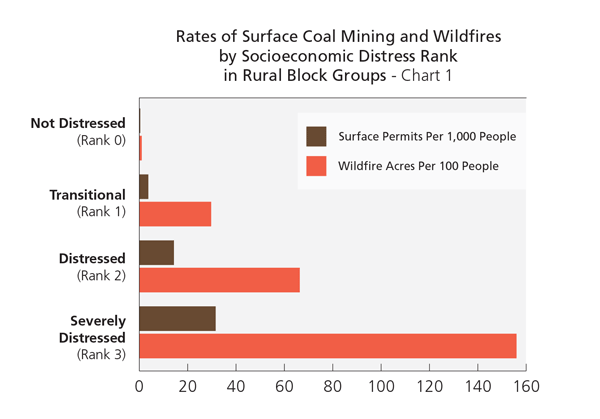
Severe socioeconomic distress exists in both urban and rural block groups. Of the 311,000 people in severely distressed block groups, 60% are urban. In rural block groups, as socioeconomic distress increases, so do indicators of environmental distress. Rates of wildfire and surface coal mining nearly double between distressed and severely distressed rural block groups (chart 1).
A broader point can be made with this analysis. Adventure tourism is a growing business nationally and a determined focus of economic development in Kentucky. Many of these types tourists seek a large network of land and water trails, especially in pristine areas. Much of eastern Kentucky had this potential, except for the cycle of unsustainable surface mining and the attending boom-bust economy that left derelict landscapes. Poor areas with scarred lands face a much harder path attaining success in this new tourism. But there is always hope. Perhaps the type of adventures grow (e.g., ATV and bridal parks on large reclaimed strip mines) or maybe regional coalitions stitch together corridors of unaltered land. The benefits are not just in tourism dollars, but also in the activity of recreation. Imagine a distress index map that also included bad health indicators.
Map was created by Boyd Shearer for GEO 309, Introduction to GIS in the Department of Geography, University of Kentucky during the Spring Semester, 2015.
Sources of data:
Kentucky Department for Natural Resources, Division of Forestry. January, 2015.
Kentucky Department for Natural Resources, Surface Mining Information System (SMIS) database, accessed March 15, 2015: http://minepermits.ky.gov/Pages/SpatialData.aspx
Short, Karen C. 2014. Spatial wildfire occurrence data for the United States, 1992-2012 [FPA_FOD_20140428]. 2nd Edition. Fort Collins, CO: Forest Service Research Data Archive. http://dx.doi.org/10.2737/RDS-2013-0009.2
US Census Bureau. 2015. 2009-2013 American Community Survey (ACS) 5-year Estimates.
2009 Sheltowee Trace South now available
After many requests from hikers and map enthusiasts, our map that shows the ST 2009 southern alignment (Pickett State Park as southern terminus) is back in a limited edition print run. Folks called nearly everyday asking for this map. We answered with a custom map edition.
While the southern terminus is now at Burnt Mill Bridge in the Big South Fork, this is the only map that shows the Sheltowee Trace between the Big South Fork and Turkey Foot. This map also shows the Kentucky Trail and long portions of the John Muir Trail, which the ST also uses.
Topography and Hemlock Habitat
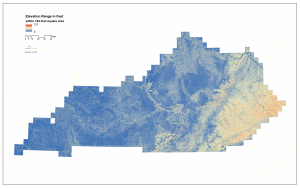
Sheltered coves and north-facing cliffs are hemlock habitats in Eastern Kentucky. This map shows range of elevation change within a 164-foot square area. Red areas indicate the highest relief, which are mountain slopes in the coal fields, and cliffs along the Pottsville Escarpment and Pine and Cumberland Mountains fault. Since most cliff is sandstone, areas indicated as cliffs would presumably have sandy soils, which is a condition for other evergreen species habitats, e.g., mountain laurel and rhododendron.
This is first-run test. Further analysis would include adding aspect, evergreen canopy cover, and soils to better refine predicting hemlock habitat.
Student final projects, Fall 2014
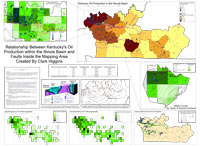
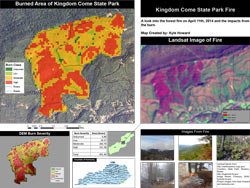
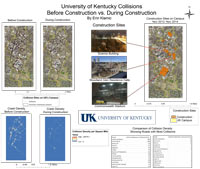
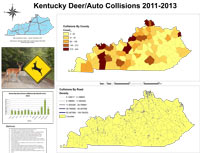
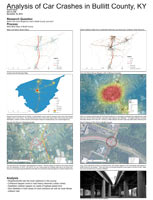
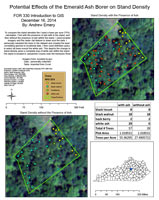
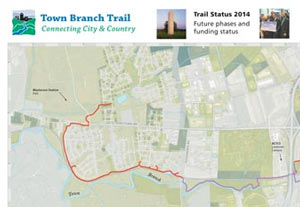
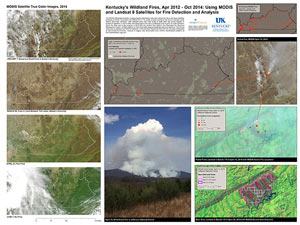
A selected gallery of student final posters from GIS courses at the University of Kentucky. Classes include, FOR 330, NRE 355, and LA 355.
Town Branch Trail and Density of Healthy Canopy
Town Branch Trail is a developing shared-use trail connecting downtown Lexington with the city’s outer countryside. The exercise shows the completed and funded phases for the trail, and assesses the extent and health of trees along the trail.
Using National Agriculture Imagery Program (NAIP)  2012 imagery an NDVI (Normalized Difference Vegetation Index) was created and then shown as a ratio per parcel area. After viewing the initial results, a student said, “This is a realtor’s map!” and then quickly visited the PVA website to compare property values to its ‘green index.’
Mapping Kentucky’s Wildland Fires with Satellite Imagery
Kentucky has damaging wildland fires, while also using prescribed burns to manage habitat. An unfortunate statistic tells us that most wildland fires in Kentucky are from arson.
This student lab uses MODIS Active Fire Detection products and Landsat 8 near-infrared bands to locate and analyze the largest fires between April 2012 and October 2014. IÂ hope to get point locations of smaller fires from Kentucky Division of Forestry to compare with satellite-based observations.
Students Like Field Trips
What can students do with a smartphone, ArcMap, and a linux server? More than just have fun outside!
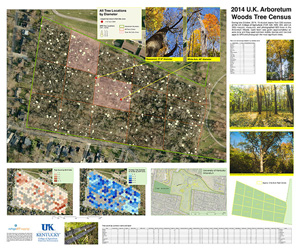
15 student teams from two GIS courses at the University of Kentucky mapped, measured, and photographed 603 trees in the Arboretum Woods. Each team (which adopted colorful team names) was given (approximately) an acre zone. They used common mobile devices and low-cost apps to GPS and photograph the most significant trees.Â
Each team made a poster and presented them during a 2014 International GIS Day event in the Thomas Poe Cooper building on UK’s campus. It was widely attended and praised for the strength of student teams’ achievement.Â
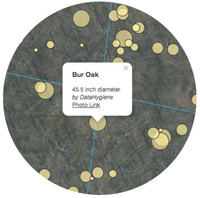
Since students photographed each tree, we made an interactive map that shows these photos and can be used for geolocation while in the woods. Using Leaflet, GeoJSON, and a Linux server, student SWEB accounts host data that feeds this interactive map:Â Look at trees now!
A Neighborhood’s ‘Green’ Index
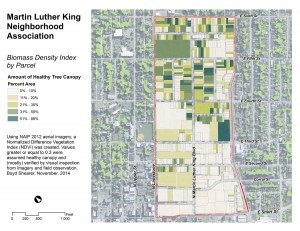
A map showing ratio of property parcels covered in healthy canopy in the Martin Luther King Neighborhood Association in Lexington, Kentucky.
Using National Agriculture Imagery Program (NAIP) 2012 aerial imagery, a Normalized Difference Vegetation Index (NDVI) was created. Values greater or equal to 0.3 were assumed healthy canopy and (mostly) verified by visual inspection from imagery and summer field observations.
Sheltowee Trace online map
We’ve started an online map for the Sheltowee Trace, because it keeps getting longer with each new season. This month, it is 319 miles (and some change) long.
This map is mobile compatible and will locate you on the trail if your device has GPS. Try it out and tell us what you think.
The map includes the new extension from Leatherwood Ford to Honey Creek.