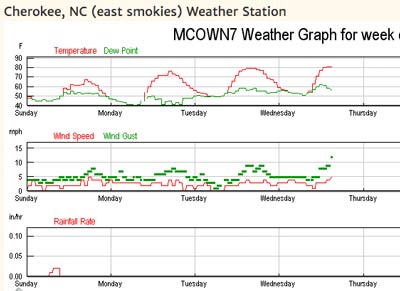
New Weather Graphs
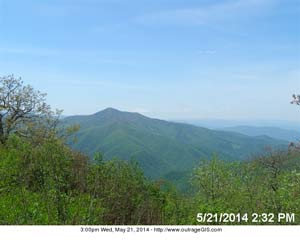
Cold Mountain web cam back up
After a severe winter, the Cold Mountain webcam is back in operation. As we move into summer, we hope all cams remain healthy so we can collect and archive animated scenes.
What we have now is pure spring delight, so please enjoy.
GEO 309 analysis in Herald-Leader

Article by Jim Warren, Herald-Leader, May 4
If you ride a bike around Lexington, there are some places where pedaling with extra caution might be wise, a new study suggests.
“Mainly, they’re places where bicycle facilities change, such as where a bike lane abruptly ends. They seem to be the trouble spots,” said Boyd Shearer, a University of Kentucky geographer who led the study of bike-vehicle collisions in Lexington.
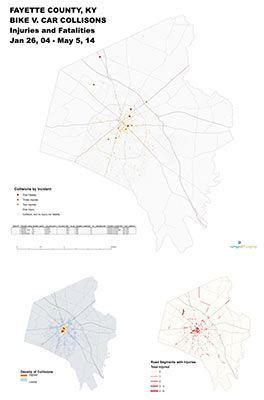
Shearer and some of his students recently studied 396 collisions between bikes and other vehicles that occurred on Lexington streets and roads from October 2008 through October 2013. The five-year list included 293 wrecks that caused injuries and three that resulted in fatalities.
After collecting wreck data from police reports, the researchers analyzed the results using a computerized mapping system called GIS that can reveal underlying relationships, patterns and trends.
“I thought it would be an interesting project to do, and that it might help the city,” Shearer said.
A bicyclist himself, Shearer has worked with Lexington planners on other bike-related projects.
He said the new study shows the area around UK had the greatest concentration of bike-versus-car wrecks. That’s not surprising, he said, given the large number of students who ride on campus.
Perhaps more surprising was that 25 percent of the riders involved in collisions during the five-year period weren’t wearing helmets. Another surprise: 21 percent of the accidents were hit-and-runs.
Most notable overall, he said, was that riders often got into trouble in places where bike lanes ended abruptly.
“The bike rider is rolling along in a lane by himself, and that lane suddenly ends,” Shearer said. “You never win against a car if you’re on a bike.”
One such spot, according to Shearer, is near where Winchester Road, East Third Street and Midland Avenue come together. A bike lane along Winchester Road ends at Walton Avenue, and an extra traffic lane for cars opens up between Walton and Midland, he noted.
“Bikers kind of get squeezed,” Shearer said.
He and his students also identified “critical segments” of four streets — mostly near UK — with high numbers of bike-car crashes during 2008-13.
They were: South Limestone north of Virginia Avenue, six wrecks; Euclid Avenue east of Woodland Avenue, five; Winchester Road near East Third Street, four; Rose Street from Euclid to Columbia avenues, four; and Rose from Columbia to Huguelet Drive, three.
Ultimately, Shearer said, he hopes to see Lexington’s bike trails linked together, which would allow riders to bike long distances sheltered from vehicular traffic.
“The Town Branch Trail isn’t connected yet,” he said. “But if it reaches downtown and the Legacy Trail is linked with it, riders could use them in lieu of streets to get in and out of downtown, not just for recreation but for real bike commuting.”
Scott Thompson, Lexington’s bike and pedestrian coordinator, said planners were looking at ways to “separate bicyclists from traffic,” whether that’s through more bike lanes or putting small barriers between bike and traffic lanes.
Jim Warren: (859) 231-3255.
Read more here: http://www.kentucky.com/2014/05/04/3227487/analysis-of-bicycle-accidents.html#storylink=cpy
Winter into Spring, Kentucky 2014
After an unusually long and cold winter, Kentucky has finally emerged to full-blown spring weather. These five images show the clearest, cloud-free day for each month from January 1 to May 5. Snow is clearly seen in the first two months and it’s striking how defined the snow lines are, perhaps 20 miles. You could have heavy snow in Lexington, but snow free in Richmond.
In the January image, we can see the hemlock and pine forest in the Red River Gorge and recently mined ares in eastern Kentucky. In the February image, Cave Run Lake appears frozen.
Another interesting observation is the rate pastures and forests leaf out. Kentucky’s pastures became green in early April, while the forests leaf out by the first days of May.
March is my favorite image. The sun is the highest while the vegetation is at the minimum. Â Soon, the explosion of photosynthesis will sweeten the earth with life.
No wildfires are seen (maybe one in April image in eastern Kentucky).
Lexington Walkability Analysis
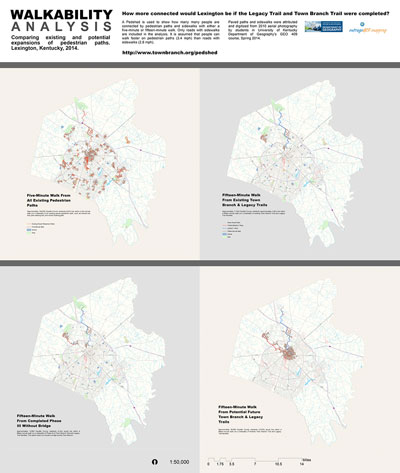
A Pedshed is used to show how many people are connected by pedestrian paths and sidewalks with either a five-minute or fifteen-minute walk. Only roads with sidewalks are included in the analysis. It is assumed that people can walk faster on pedestrian paths (3.4 mph) than roads with sidewalks (2.8 mph).
Paved paths and sidewalks were attributed and digitized from 2010 aerial photography by students in University of Kentucky Department of Geography’s GEO 409 course, Spring 2014.
This analysis has a focus on existing access and potential future access (of various completed designs)of Lexington’s two longest shared-use trails, the Legacy and Town Branch Trails.
Analysis Results
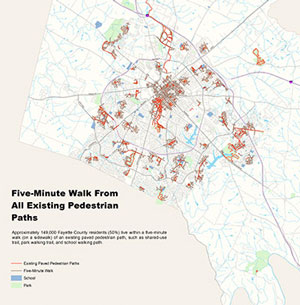
Five-Minute Walk From All Existing Pedestrian Paths
Approximately 149,000 Fayette County residents (50%) live within a five-minute walk (on a sidewalk) of an existing paved pedestrian path, such as shared-use trail, park walking trail, and school walking path.
Fifteen-Minute Walk From Existing Town Branch & Legacy Trails
Approximately 11,500 Fayette County residents (approximately 3.8%) live within a fifteen-minute walk (on a sidewalk) of existing Town Branch Trail and Legacy Trail facilities. View a dynamic map of this scenario here.
Fifteen-Minute Walk From Completed Town Branch Trail Phase III Without Bridge Across Town Branch
Approximately 12,800 Fayette County residents (4.3%) would live within a fifteen-minute walk (on a sidewalk) of Phase III of Town Branch Trail and Legacy Trail facilities. This option does not include a bridge across Town Branch.
Fifteen-Minute Walk From Potential Future Town Branch & Legacy Trails (with bridge across Town Branch)
Approximately 38,900 Fayette County residents (12.5%) would live within a fifteen-minute walk (on a sidewalk) of finished Town Branch Trail and Legacy Trail facilities. Â View a dynamic map of this scenario here.
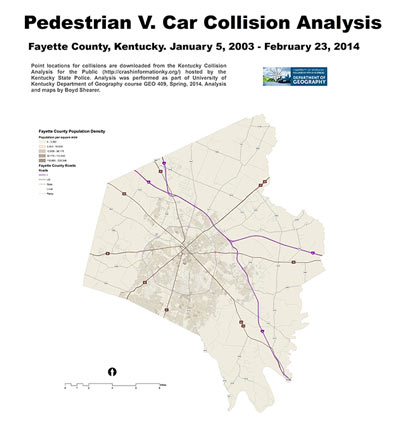
Pedestrian V. Car Collision Analysis
Maps and Analysis
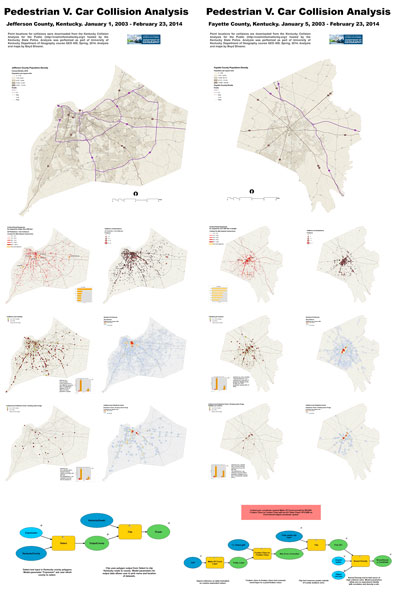
Point locations for collisions were downloaded from the Kentucky Collision Analysis for the Public (http://crashinformationky.org/) hosted by the Kentucky State Police. Analysis was performed for Kentucky’s Fayette and Jefferson Counties for data period January 5, 2003 – February 23, 2014 as part of University of Kentucky Department of Geography course GEO 409, Spring 2014.
Louisville Statistics
- AMONG ALL COLLISIONS
4,592 pedestrians v. car collisions occurred with 173 pedestrian fatalities (3.8% of total) and 4223 pedestrian injuries (92% of total). - AMONG ALL COLLISIONS WITH PEDESTRIANS USING ALCOHOL OR DRUGS
257 pedestrians v. car collisions occurred with 26 pedestrian fatalities (10%) and 227 pedestrian injuries (88% of total). - Rate: 6.1 collisions per 1,000 current residents
- Download Map
Lexington Statistics
- AMONG ALL COLLISIONS
1,689 pedestrians v. car collisions occurred with 47 pedestrian fatalities (2.9% of total) and 1580 pedestrian injuries (94% of total). - AMONG ALL COLLISIONS WITH PEDESTRIANS USING ALCOHOL OR DRUGS
130 pedestrians v. car collisions occurred with 9 pedestrian fatalities (6.9%) and 118 pedestrian injuries (91%). - Rate: 5.5 collisions per 1,000 current residents
- Download Map
Analysis and maps by Boyd Shearer.
Scenic Landscape Index
Summary
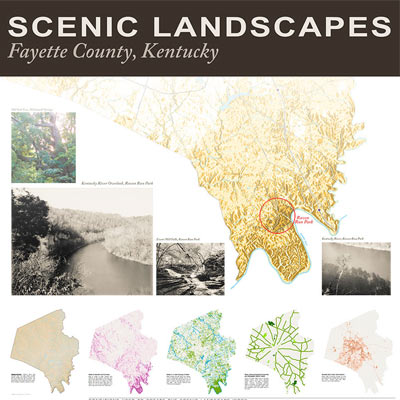
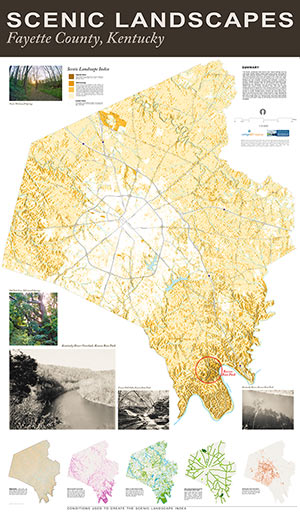
This index favors more natural settings such as rural areas, forests, stream valleys, larger public parks, and areas of high relief. National Register of Historic Properties are included and while most properties were small and located in the urban core, larger properties with tree canopy scored a relatively high value in the index; Ashland and the Lexington Cemetery are examples. Locations in southern Fayette County scored the highest values because of their proximity to the forested cliffs of the Kentucky River Palisades. Neighboring river tributaries, such as Boone Creek and Elk Lick, extend high scenic values northward.
The area with highest contiguous value is Raven Run Park, primarily because it is publicly accessible, though unfortunately not during the time one might watch a sunrise or sunset. Notable scenic corridors are found along Town Branch, and the North and South Forks of Elkhorn Creek. Because the data used to calculate this index is from 2001 and 1998, some areas that score a high value, e.g. Hamburg area, have since been altered and would score lower values as the density of the built environment increased.
Methodology
Scenic conditions were converted to raster datasets and assessed an integer value based on a location’s proximity to tree canopy, water, historic areas, parks, scenic roads, and the probability of seeing a sunrise or sunset at that location. Those conditions are shown in the Fayette County maps found at the bottom of this page. A location is defined as a 5-foot resolution raster cell. Using Map Algebra, all raster datasets were overlaid to find which locations had the greatest number of scenic conditions. The resulting map provides a relative scenic landscape index. Locations with higher values in the index have more scenic conditions. For example, areas with the highest values offer the best chance to see a sunrise or sunset in a natural setting of forested parks, historic areas, or rural places with ponds or lakes. Areas with the lowest values are primarily dense urban environments without tree canopy cover, parks, historic areas, or ponds.
Layers in Index
Views of Sunsets and Sunrises is an index of areas to view sunsets and sunrises on the solstices, assuming one has a clear view of the sun at 8 degrees above the horizon on these two days. Areas that had the most likely view of a sunset or sunrise were awarded more value than areas with a less likely view.
Proximity to Tree Canopy and Water is an index of areas that are under tree canopy or on a waterbody (greater than a 1/4 acre), or within 200 feet of either. Any of these conditions awarded equal value in the index. Tree canopy derived from 1998 aerial photography.
Parks, National Register of Historic Properties, and Scenic Roads is an index of areas that were state parks or passive natural setting parks were awarded higher value in the index. Community parks, publicly accessible national register properties, and areas within 500 feet of county designated scenic roads were awarded lower, but equal, value in the index.
Densely Built Urban Environment is an index of areas with increasing density of built environment were awarded lower values in the index. Derived from the 2001 National Land Cover Database.
Snow, Clouds, and Contrails
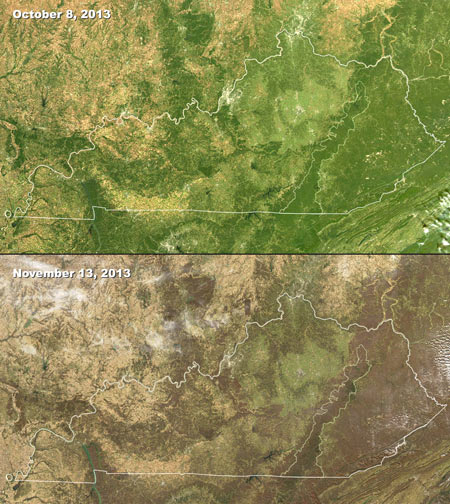
Kentucky transitions into fall
These satellite images are from the Moderate Resolution Imaging Spectroradiometer (MODIS) instruments on two satellites, Aqua and Terra. MODIS captures 36 electromagnetic wavelength bands to measure atmospheric water vapor, ozone, aerosols, land fire, surface temperature, and many other important variables of global climate. These images are visible light and clearly show the change in deciduous canopy cover within roughly a month of time. Spatial resolutions are between 250 m to 1 km.
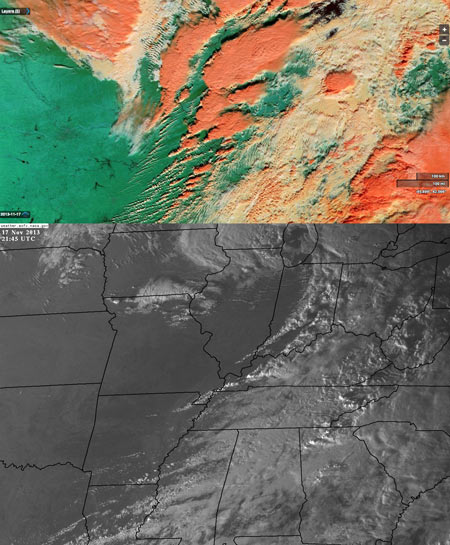
Signature of a Supercell
These satellite images show the unusual tornado outbreak that occurred on November 17, 2013. The top image captured, in false color, the height of clouds at the time when supercell thunderstorms were generating tornados in Illinois. Note the pancaking or mushrooming of the tallest clouds with feathering to the northeast and a distinct northern shadow; those are the classic anvil clouds and a signature of a supercell thunderstorm.
In the black and white image below, we see storms a few hours later. A supercell is located in western Kentucky. The setting sun highlights many tall thunderstorm clouds.
The Daily Aesthetic Oral Histories
Between 1996-1998, I completed about 30 hours of oral histories about once-segregated black parks in Kentucky. About six hours are available online at the University of Kentucky Louie B Nunn Center for Oral History. They’re missing my interview with John Will “Scoop” Brown, a Lexington park programmer and raconteur of zoot suits in Douglass Park. More to be available to be sure.
Here’s the oral history index: The Daily Aesthetic: an oral history of a southern city’s black park system, 1916-1956
“This project focuses on African American culture during the time of segregated park systems in Lexington, Kentucky. These interviews, originally conducted by Boyd Shearer, Jr. for a multimedia presentation, contain descriptions of African American park activities, particularly in Douglass Park. Activities ranged from doll shows, to carnivals, to sports programs. This community also celebrated the visual arts, music, and holidays such as the 4th of July and Easter. The focus of this collection is not discrimination experienced by African Americans at this time, but rather how the park provided a place for them to come together and cultivate a sense of identity and community.”
For an audio documentary using some of these interviews, visit:Â http://www.outragegis.com/trails/2001/08/08/at-leisures-edge/. The documentary can be downloaded or viewed on SoundCloud. A complete audio script is available.
A paper from this research was produced:
index:Â http://www.uky.edu/Projects/TDA/archive/TableofContentsandAbstract.pdf
main body: http://www.uky.edu/Projects/TDA/archive/TDA.pdf
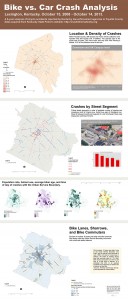
Bicycle vs. Car Crash Analysis
Lexington, Kentucky. October 15, 2008 – October 14, 2013.
 An analysis of bicycle accidents reported by Kentucky law enforcement agencies over 5 years in Fayette County.
Of all workers (16 years and older) living in the Urban Service Area, only 0.94% say the actively bike commute to work. Within 0.5 miles of a bike lane or sharrow, the share of workers saying they bike commute rises to 1.7%. Also, 89% of bike commuters live within a half mile of a bike lane or sharrow. It is estimated that 25% of all reported accidents have happened on streets with a sharrow or bike lane.
Distressed Kentucky Areas
Socioeconomic and Environmental Distress by Block Group in Kentucky
A preliminary fact: Landsat Annual Timelapse 1984-2012 (from Google’s Earth Engine project) shows a glimpse of the vast impact of surface mining in the eastern Kentucky coal fields.
Kentucky’s population is nearly balanced between urban and rural. 52% of Kentucky’s population lives in rural census block groups¹. Economic and social distress² is more likely to occur in rural areas. 61% of Kentucky’s distressed population lives in rural areas.
Surface coal mining³ mostly occurs in rural areas and the highest rate of mine permits to population occurs in distressed rural areas. 99.3% of mine permits exist in rural areas.
The rate of mine permits to persons is 12.8 permits per thousand residents in all distressed areas, 4.24 permits per thousand residents in transitional areas, and .221 permits per thousand residents in non-distressed areas. In the most severely distressed rural areas, the rate is the highest at 32.0 permits per thousand residents.
61.2% of all distressed rural areas have mine permits.
Boone Trace

Boone Trace from James Boone Gravesite Marker to Fort Boonesboro
We’ve been working for a client developing a Boone Trace map and guide requiring maps at a few different scales. One scale is the “big picture” map and we selected a 3D basemap for this overview, letter-sized map. I spent only a few hours labeling the map, but with a little more work, I think it will look good. The color intensity might need to be reduced, if it’s decided to use the 3D map. It be more appropriate to make a simple line drawing map, in a nod to older map markers and the historic nature of the subject.
Many more hours were used to develop the driving tour basemap. Bringing in Kentucky state GIS data, the map was developed and labeled with shapefiles in TileMill. The idea is to build a good basemap for the client using online proofing and updating. After the production format and scale are chosen, we’ll create bounding boxes and clip out the print pages. TileMill styling and label placement can easily be transferred to Illustrator and with the goal of quickly designing a final proof.
Works in Firefox, Chrome, Safari, and IE8. You’ll need to run compatibility mode if your browser is IE9 or greater.
The Woodland Art Fair Weekend
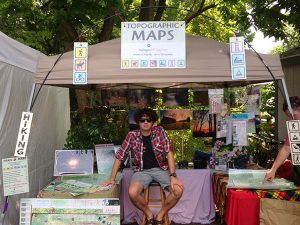
What an awesome weekend! We want to sincerely thank all of our friends, new and old, who came by our booth to talk about their adventures and uses of maps. We couldn’t have been happier after a busy day’s work with the excitement folks still have for good ‘ol paper maps. It’s inspiration that fuels our tanks. The weather held, this year’s food and beverage selection was superior, and our neighbors were fantastic. That’s why we say awesome!
One visitor, Emmett, epitomizes our type of person who loves maps and loves to use them. He recently moved to Lexington and committed himself to hiking all the official trails in the Red River Gorge. As he was outfitting his gear at Lexington’s Benchmark outdoor store, he came across one of our publications.
After a few dozen miles of using our map in the backcountry, he said, “That map was the best $15 I ever spent, hands down.” After he hikes all the trails, he’ll mount and frame his maps. Emmett, we’re gonna hold you to your pledge to send us a photograph of the framed map set.
This was our eight year at the same spot in the Woodland Christian Church fair annex. While we perhaps don’t have the same number of visitors as the Woodland Park grounds, we love our shady corner at the bottom of the hill.
We hope to see you next year and thanks for all your support!







You must be logged in to post a comment.