National Land Cover Database on SheltoweeTrace.com

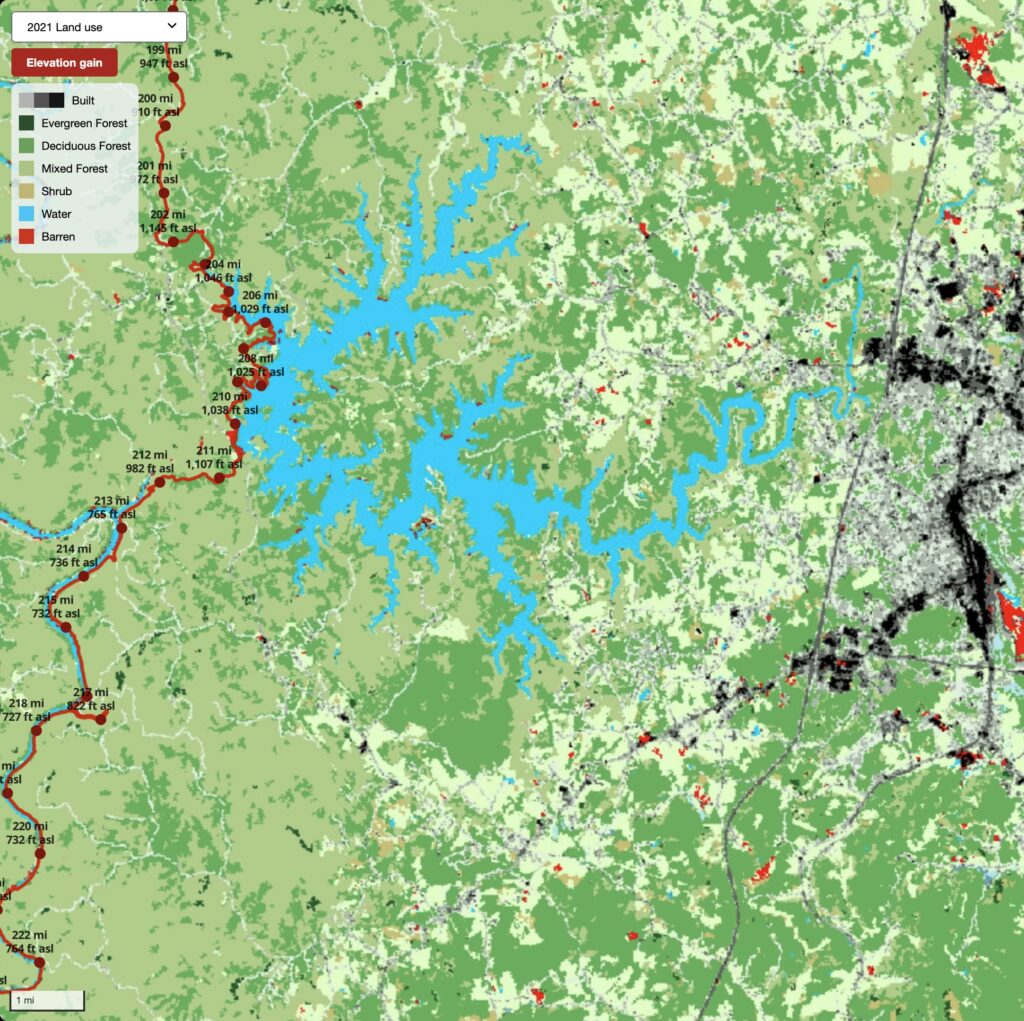
Two new layers have been added to the web map for the Daniel Boone NF and Big South Fork NRRA: the National Land Cover Database (NLCD) for 2021 (mrlc.gov) and mined lands, 1985–2020 (skytruth.org). The NLCD is a 30-meter resolution (each cell is 30×30 meters) land cover dataset showing each cell’s dominant land use.
Screenshot of land cover map at SheltoweeTrace.com
Screenshot of the land cover map at SheltoweeTrace.com

The cells are symbolized to show features significant for the area, such as multiple types of vegetation cover, the density of the built environment, and barren land. Inside the NF and NPS boundaries, barren land is likely to be exposures of bedrock, boulders, and earthen materials. For example, it shows Cumberland Falls. Outside of these boundaries, barren land is likely mines or construction sites.

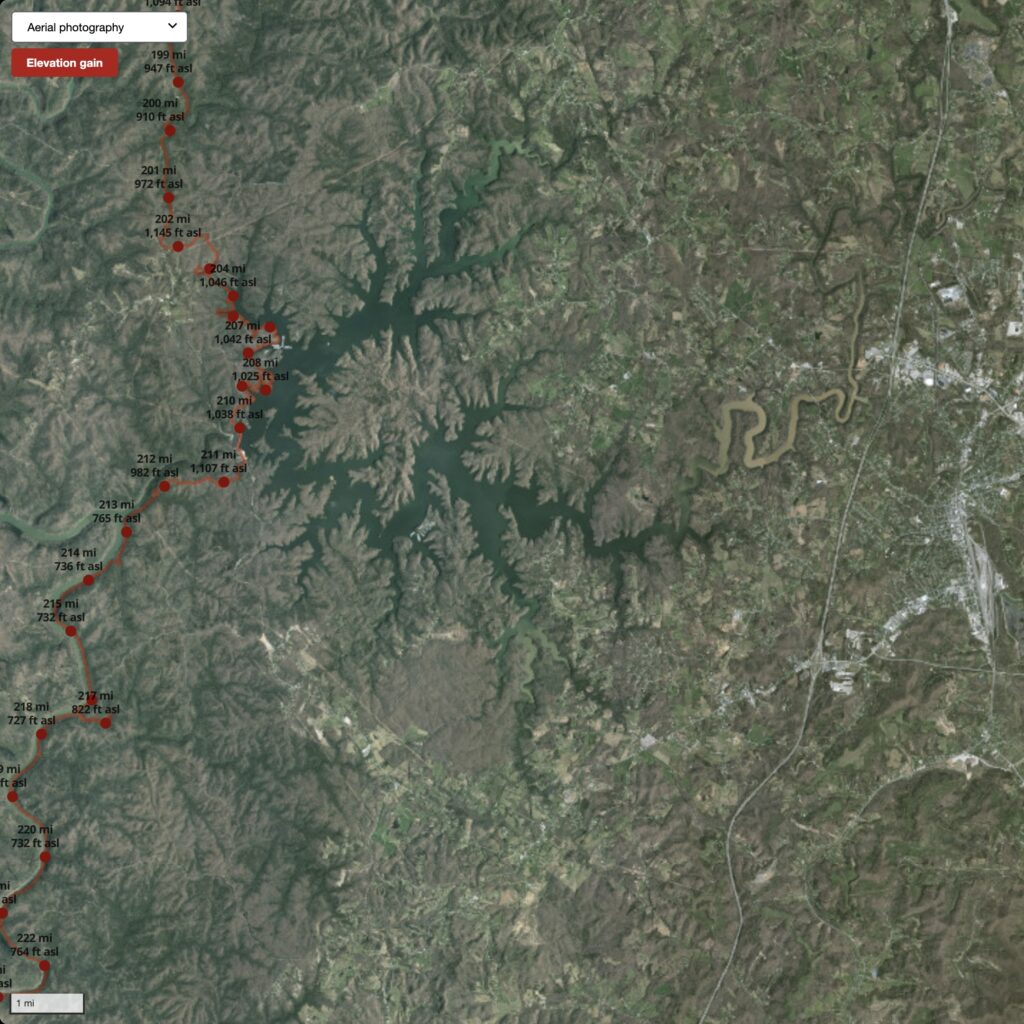
While the layer is low-resolution compared to the aerial photography layer, the NLCD helps us quickly understand landscape conditions that would be tedious to interpret from aerial photography alone.
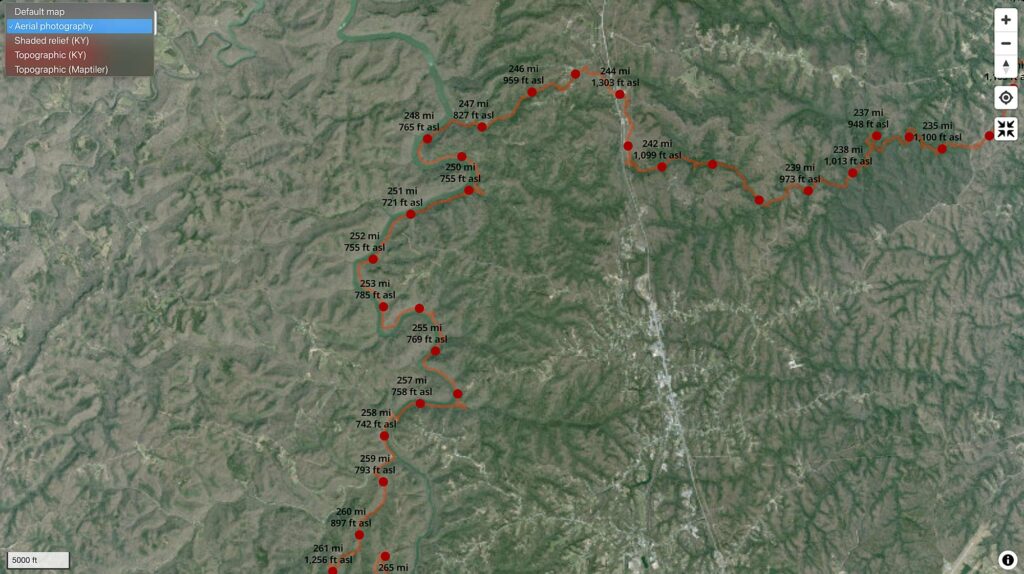
Screenshot of aerial photography map at SheltoweeTrace.com

One can identify the distribution of basic forest types and habitat patterns. The NLCD can be useful for understanding the extent of the wildland-urban interface — a vital consideration for Trail Towns, maintaining wildlife corridors, and managing tourism development in the region.

The NLCD layer, in conjunction with other layers on the web map, provides a comprehensive view of the public lands in the region. Before your next trip to the Daniel Boone NF or Big South Fork NRRA, take a look at all layers to get a sense of the landscape you will be visiting.
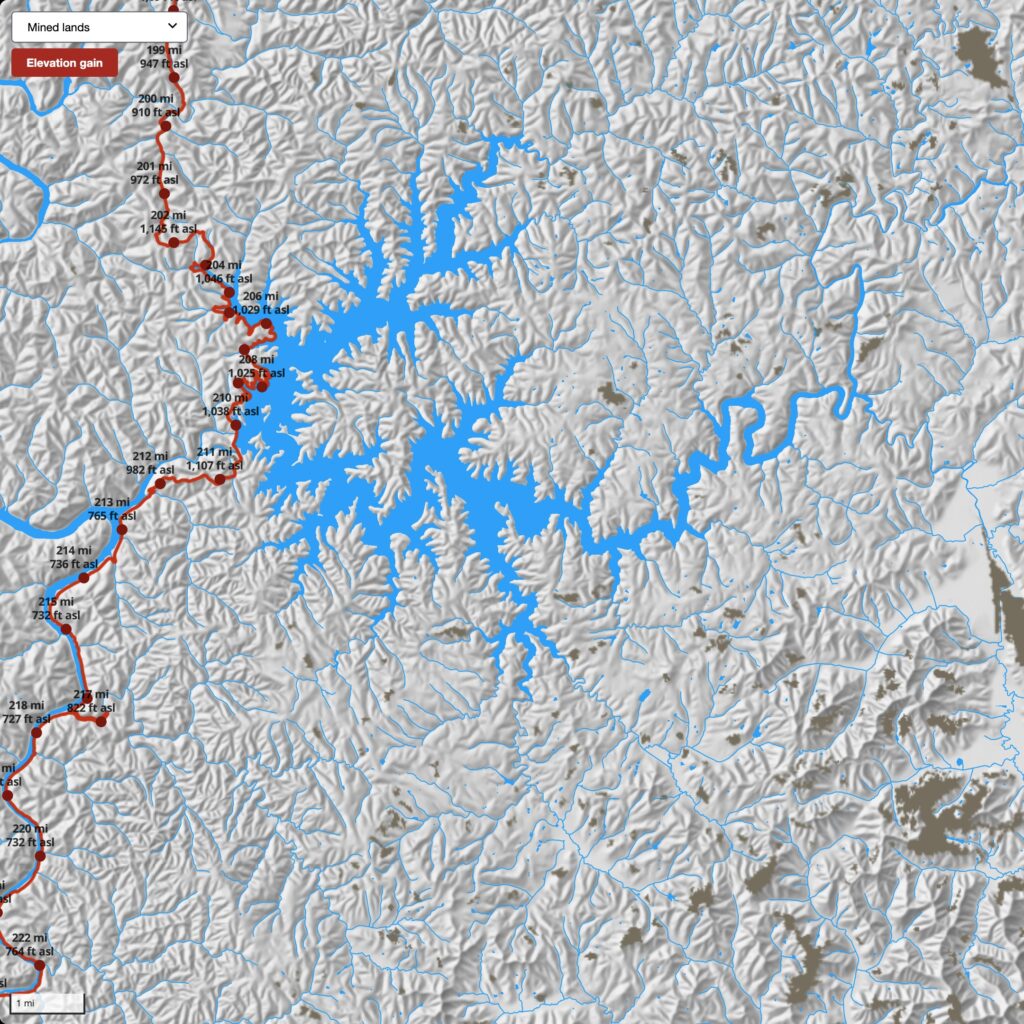
Screenshot of lidar-derived shaded relief map at SheltoweeTrace.com
Screenshot of mined lands map at SheltoweeTrace.com
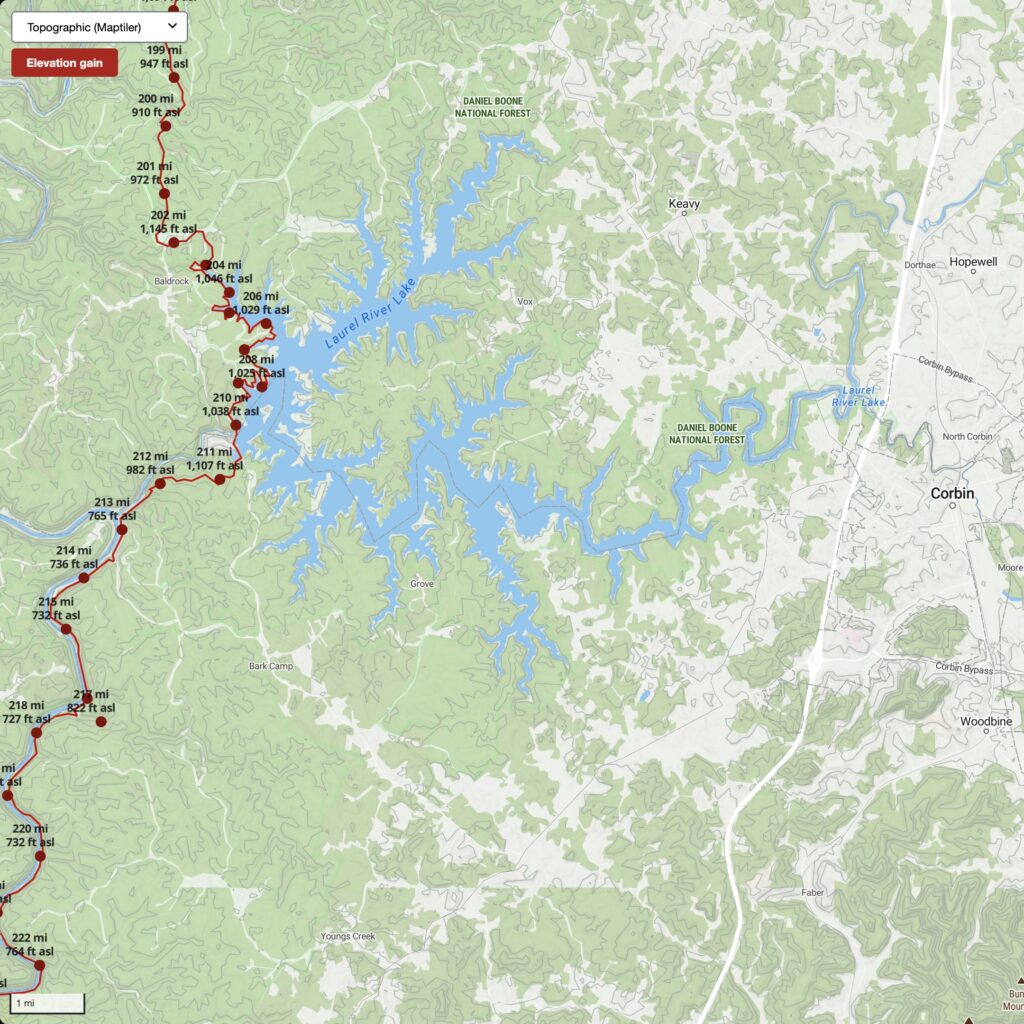
Screenshot of general topographic map at SheltoweeTrace.com
Screenshot of the general topographic map at SheltoweeTrace.com

The interactive map is available at: https://sheltoweetrace.com

Yahoo Falls

Yahoo Falls Picnic Area is located in the Big South Fork National River and Recreation Area in Kentucky. The scenic area contains short hikes and overlooks of the Cumberland River and Yahoo Falls, an impressively tall waterfall. The area is surrounded by the Daniel Boone National Forest with a variety of trails and camping options. You can create a 9-mile loop hike by combining the Yahoo Falls Trail, Sheltowee Trace, and USFS 602 & 612 trails.

Yahoo falls

Backpacking tips. While no camping is allowed in the Picnic Area, Alum Ford primitive campground is about 2 miles south on the Sheltowee Trace. Big South Fork manages the campground and it is $15/night. There is no water or electricity at the campground and cellular service is weak along the Cumberland River. Hit me up for additional tips. Get lost and have a blast.

New base maps for Sheltowee Trace

Find high-resolution aerial imagery and shaded relief maps for Kentucky (and some for Tennessee) on SheltoweeTrace.com.

Base maps for sheltoweetrace.com

We’re adding new base maps for our Sheltowee Trace map. The current maps are:

  • Default map shows a generalized shaded relief, hydrologic features, and public land.
  • Aerial photography shows 2-ft pixel resolution, leaf-off 2019 imagery.
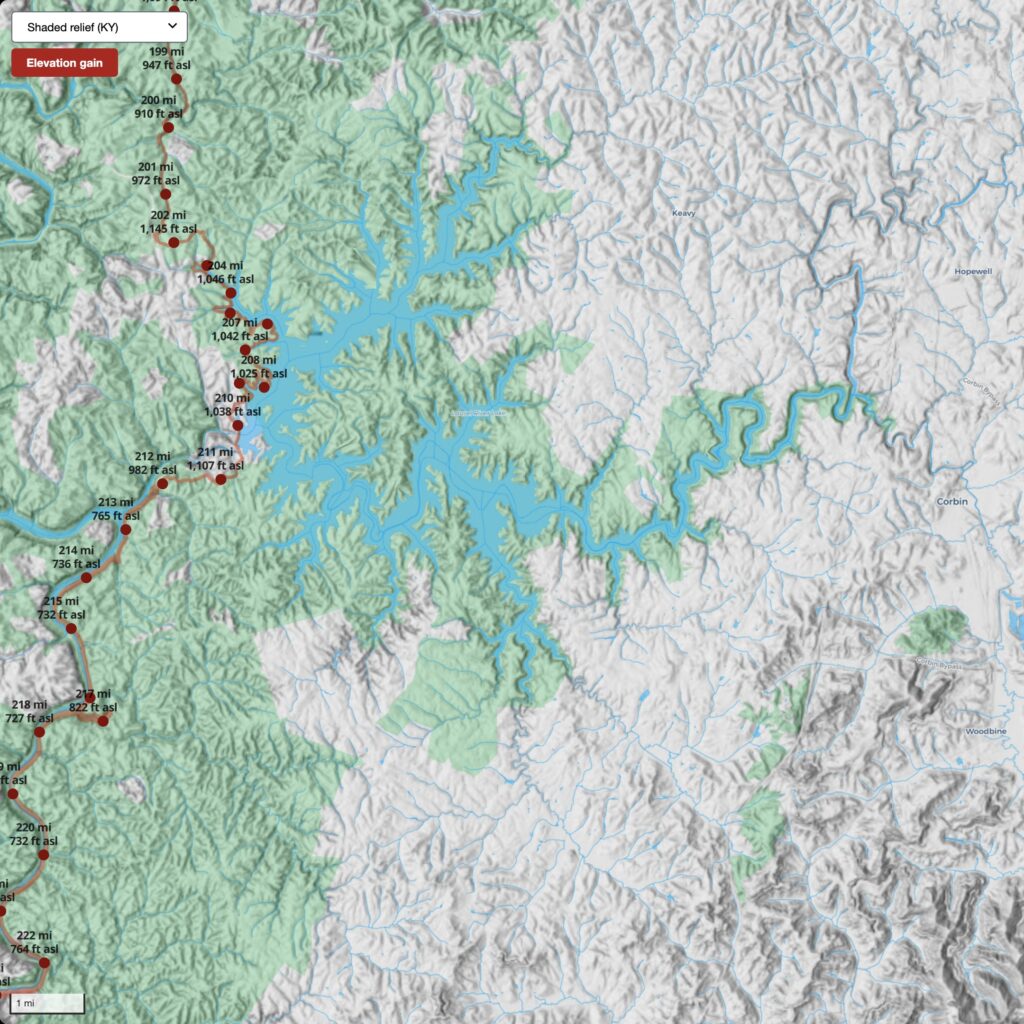
  • Shaded relief (KY) uses KyFromAbove point clouds from 2010s to create a shaded relief detailed enough to show trail and road beds.
  • Topographic (KY) shows the Topographic map series created by the Kentucky Division of Geographic Information.
  • Topographic (Maptiler) displays a modifed Maptiler Outdoors base map. It is a global base map pulled a variety of open-source data. Trail and other information portrayed on this base map is not maintained by outrageGIS mapping. Also, elevation contours can show errors around 100 feet.

Cumulative elevation gain calculator

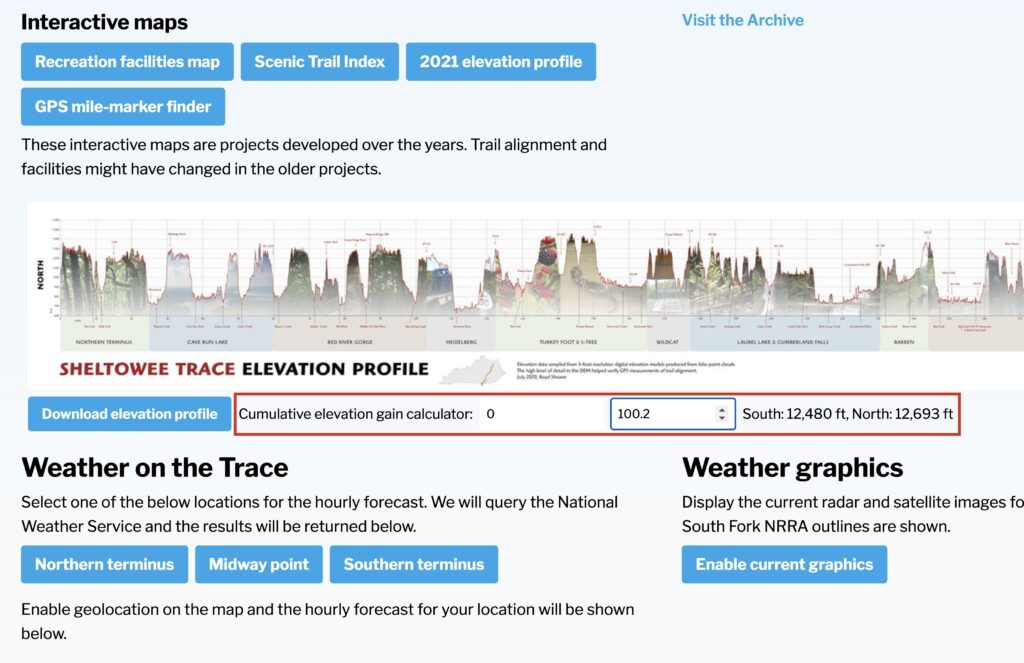
How much elevation gain did you have on your last Sheltowee Trace hike? We built a calculator and elevation profile on SheltoweeTrace.com.

Cumulative elevation gain calculator on sheltoweetrace.com

The data used in the calculator is pulled from lidar point cloud elevations created in the mid-2010s. Digital elevation models (DEM) derived from these point clouds have a 5-ft spatial resolution and are detailed enough to show wider trails in shaded relief rendering of the DEM. The point elevations for the Sheltowee Trace are sampled every 1/10th of a mile and allow for calculating gains between mile markers with a single decimal place. The result shows both southbound and northbound gains.

A simple GPS tool for the phone

If you visit this site often, you likely have a favorite map app on your phone. I certainly do and I have installed dozens of apps over the years. Most focus on placing your location as a dot on the map.

The dot

Any map app that shows your location as a dot on the map fosters a dependence on your exact location. We end up saying, "I am here" instead of asking "Where am I?"

To build strong spatial awareness, we should look at the dot after studying the plain map and doing an exercise in terrain association. Can we orient the map (best done with a paper map, folks) so that map north aligns with observed north? Can we then identify features on the map and estimate their distance from us?

These are questions in topograhic map reading. If you carefully observe your environment and compare its representation on the map, you will not need the dot.

When there was no dot

Let’s say the early 1990s. Before that time, we used paper maps. Soon after, handheld GPS units became popular and only showed coordinates for your position and maybe some other location statistics like speed, elevation, distance & bearing to next waypoint. They were often used with a paper map that had a grid (with linear units on a flat space) or a graticule (angular units on a curved space) that helped a user measure their location.

Using coordinates, we looked at the paper map’s margin for marks that pointed you to a general location. To find the exact location, we looked up and asked, "Where am I?" and compared the map with what we saw. We built a mental map of our surroundings. There was no dot.

An app without a dot?

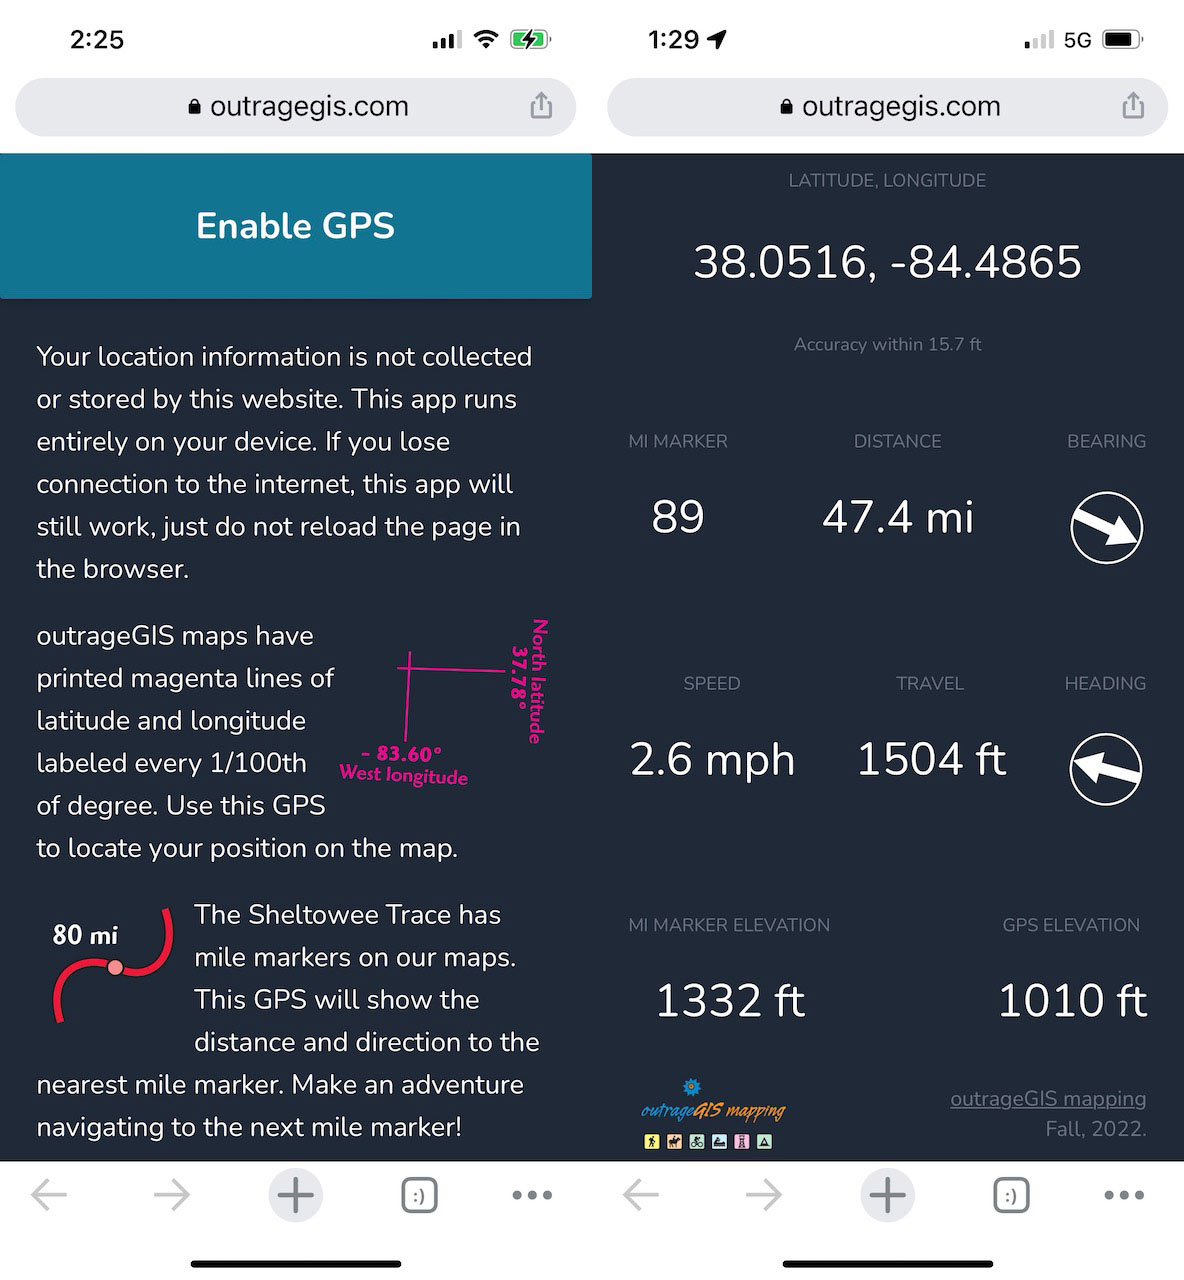
So, we thought we would kick it back to the 90s and make a browser app that mimics these early devices. Because our maps have detailed graticules and mile markers for the Sheltowee Trace, this app should compliment your journey into topography and map reading. This app is designed for mobile devices and below is a screen capture of a use on an iPhone.

Screen Capture of control panel

GPS app can be loaded here: https://outrageGIS.com/gps

This app is free, open source, doesn’t need to be installed, and won’t collect any information from you.

Happy adventures!

Toward a scenic trail index

Sheltowee Trace, Daniel Boone National Forest, and Big South Fork scenic trail index
Visit the web page

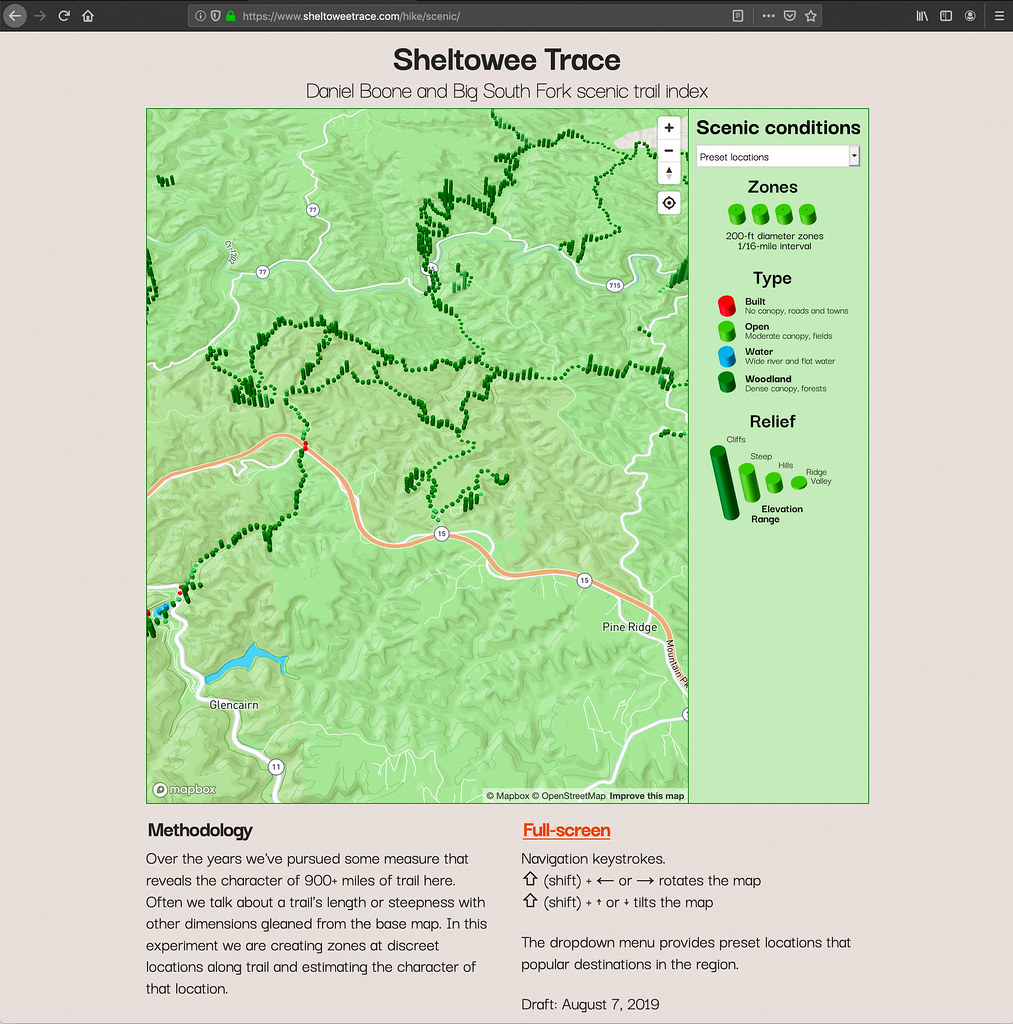
Over the years we’ve pursued some measure that reveals the character of 900+ miles of trail here. Often we talk about a trail’s length or steepness with other dimensions gleaned from the base map. In this experiment, we are creating zones at discreet locations along trails and estimating the character of that location.

Over 14,000 polygons are shown on this 3D Mapbox map. The color indicates the type of scenery and height shows how much relief is the area. Future additions to this map include adding a searching tool and summary statistics for each trail.

New images and data from GOES-16

Visit the page to view and download imagery

Over Christmas break, it was time to automate collecting and displaying the incredibly detailed imagery from the GOES-16 Advanced Baseline Imager. A problem that plagued previous efforts was not accessing the raw data, a netCDF formatted file for the contiguous U.S. which can be downloaded freely from a variety of cloud data hosts. With the raw data, one can project, modify and use it in web mapping libraries like Leaflet.

This page offers a slippy map of grayscale and color imagery and is updated every 15 minutes. You can download GeoTIFFs of rendered layers that can be used in GIS applications.

Sheltowee Trace interactive mobile map

Locate yourself on the ST

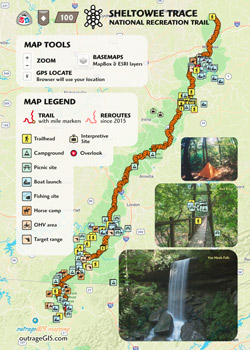
We’ve updated our map of the Sheltowee Trace on our ST site: sheltoweetrace.com/hike. The map has symbols for official recreation sites and trails for the Daniel Boone National Forest, Big South Fork National River and Recreation Area, and Cumberland Falls and Natural Bridge State Resort Parks. Of course, it has the ST and mile markers from the northern terminus.

Since we deployed this map last year, we have updated the Leaflet and MapBox JS to make the work with a GPS-enabled device as long as you have a cellular data connection. The points of interests and trails are clickable with useful travel information.

Our next goal is to fill out the map with more scenic destinations and include more photographs. Let us know if you have any suggestions.

[Read more…]

Sheltowee Trace South, 2015

Six 19" x 27" pages

Six 19″ x 27″ pages

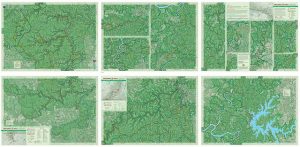
We’ve finished our Sheltowee Trace South, 2015 map. This rich color topographic trail map includes almost the entire Big South Fork National Recreation and River Area and the southern half of the Daniel Boone National Forest.

Map is six 19″ x 27″ pages and is available laminated. Check it out!

Kentucky transitions into fall

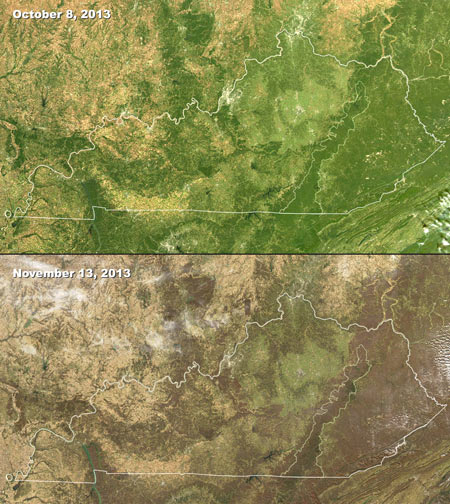
MODIS images of changing seasons in Kentucky, 2013

MODIS images of changing seasons in Kentucky, 2013


These satellite images are from the Moderate Resolution Imaging Spectroradiometer (MODIS) instruments on two satellites, Aqua and Terra. MODIS captures 36 electromagnetic wavelength bands to measure atmospheric water vapor, ozone, aerosols, land fire, surface temperature, and many other important variables of global climate. These images are visible light and clearly show the change in deciduous canopy cover within roughly a month of time. Spatial resolutions are between 250 m to 1 km.

Big South Fork in Early Fall

The first weekend of the October saw us in the Big South Fork country enjoying a dramatic change in weather. The first day was warm and sunny, but as evening set, the winds increased and rustled the treetops throughout the night. The morning was overcast, mild, and as we began our descent into the Big South Fork at Blue Heron, the sky thickened into sweeping rolls of stratocumulus clouds.
[Read more…]

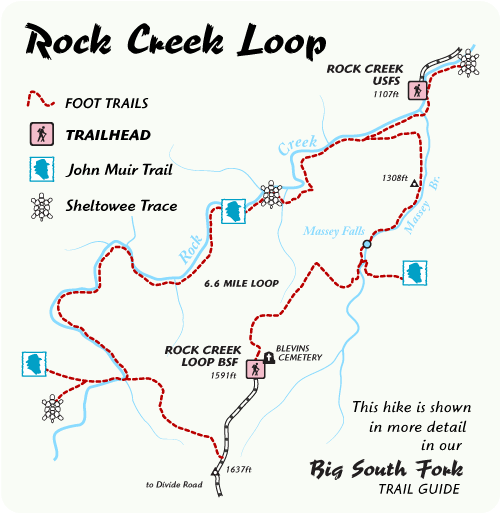
Rock Creek Loop, a cool summer hike

Twin ArchesHiker Big South Fork Map
Distance: 6.6 Miles round-trip
Difficulty: ++
Scenic Views: +++
Elevation Relief: 520ft ^
Ownership: Big South Fork, NPS

Big South Fork Trail Map: $12

Hike the scenic crossroads of the John Muir Trail and Sheltowee Trace. Rock Creek Loop is a 6.6-mile loop in our Big South Fork Guide. Half of this loop follows the cool waters of Rock Creek, a trout stream with small stretches of swift water and deep pools for summer refreshment.

Hikers weave through a forest dominated by old, stately Hemlock and American Beech trees with grassy, wildflower areas along the stream bank. The trail is a rugged footpath with a bridge across Massey Branch. Numerous backcountry campsites along the loop offer great weekend backpacking options with side trail options into Pickett State Park and the Daniel Boone National Forest.

Rock Creek Loop

El Niño to make the mountains colder and drier this winter

Predicting climate in the old days relied upon observing cues in nature. The Farmers’ Almanac finds that people looked at woolly worms in late summer in get a sense of winter. The more black hairs on the worm, the colder and wetter the winter. Of course woolly worms come in all configurations of black and orange colorings so how could a worm’s coat predict winter? It can as an analogy;  you look at the forecast to decide which coat you’re going to wear before leaving home. I think you would want to wear a black coat as opposed to a white coat on a very cold and sunny day to maximize the amount of solar energy you could absorb. Woolly worms just plan far ahead.

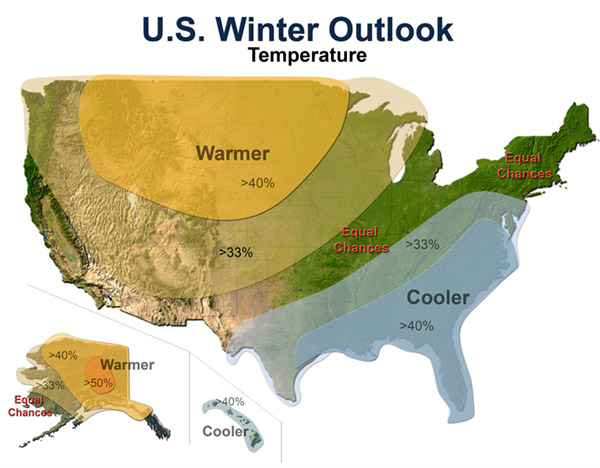
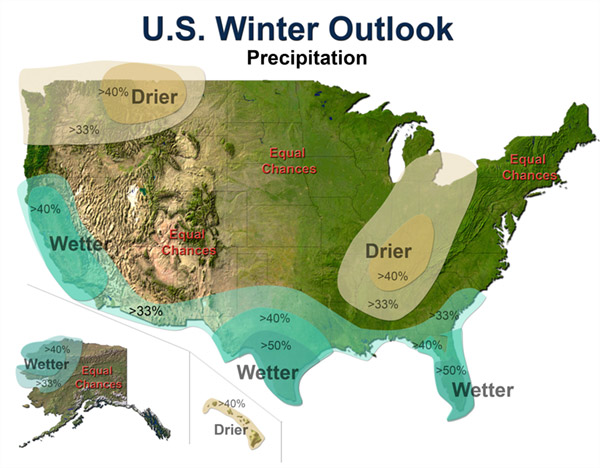
Today we track global changes in wind patterns and sea surface temperatures to predict weather conditions. NOAA’s Climate Prediction Center has issued a climate forecast for this winter based on the El Niño pattern emerging in the Pacific Ocean.

Below are winter predictions for the U.S. indicating greater or lesser chances for departures in average winter temperatures and precipitation.

temps

precip

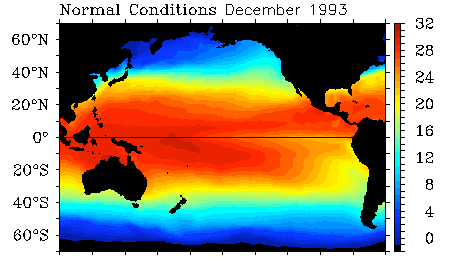
El Niño is a departure from average sea surface temperatures created by a change in the intensity and direction of equatorial winds. In a normal period, strong easterly trade winds blow across the Pacific and upwell cold, nutrient rich waters on the west coast of South America. These same winds also pile up water in the western Pacific so that the sea surface is about 2 feet higher at Indonesia than at Ecuador.

Normal Sea Surface Temperatures in °C

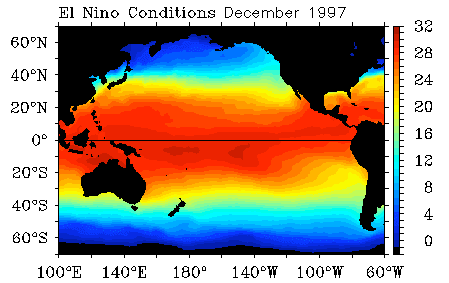
In an El Niño cycle, the winds are not as intense and warmer sea surface temperatures extend further to east. This change has a global impact on weather with increased precipitation on the west coast of South America and the south & east coasts of North America. Warmer than normal conditions also occur at higher latitudes in North America and over the Pacific ocean.

El Niño Sea Surface Temperatures in °C

El Niño Sea Surface Temperatures in °C

Sept 12: Sheltowee Trace Meeting in Winchester

The Future of the Trace: Sept 12, 2009

Join a group of trail enthusiasts and forest & park officials at the Daniel Boone NFS headquarters in Winchester to discuss the future of the Sheltowee Trace. We need as many committed folks as possible to attend. Voice your support for the Sheltowee Trace.

If you would like to attend, you can RSVP here with a comment so we can plan for breakfast and lunch!

Time: 9:30am
Where: Clark County Extension Office (map below)
1400 Fortune Dr
Winchester, KY 40391-8292
(859) 744-4682

Preliminary Agenda

9:30 to 10:00 – Meet and Greet – Coffee, Juice and Bagels, Donuts provided.

10:00 Opening Comments

  • Frank Beum, Forest Supervisor, Daniel Boone National Forest
  • Steve Handley, Big South Fork National Recreational Area, National Park Service
  • Carey Tichenor, Ky State Parks and Recreation
  • Steve Barbour, Interim Executive Director, The Sheltowee Trace Association

10:30 – Updates on the Current Condition of The Trace in each Ranger District and Plans for the next 12 to 24 months

10:45 – Current Management Plan Development

  • Federal and State Funding Levels
  • Challenges of a Muti-use Trail
  • Current on-going volunteer programs
  • Short Term and Long Term Maintenance Issues
  • Trace Blazing – Signage
  • Land Acquisition
  • Trace Relocation
  • Maintaining Easements
  • Development of the Volunteer Base
  • Promoting The Trace across the state

Following these discussion will be a session on forming the Sheltowee Trace Association, a non-profit dedicated to promoting and protecting this National Recreation Trail.

Map:Here

Rainy May: on track to be the wettest May ever

Spring is typically a wet month. However over the past week, Eastern Kentucky has experienced unusual rainfall amounts. The record for the month is 10.78 inches in 2004; and no other year has been above 10 inches for May. The only year that saw over 9 inches of rainfall for May was in 1995. May during 1983 and 1984 were the only times over 7 inches of rainfall.

From the National Weather Service in Jackson, Kentucky:

"2 TO 5 INCHES OF RAIN HAS FALLEN ACROSS EASTERN KENTUCKY DURING THE
MONTH OF MAY. THIS IS OF INTEREST...SINCE WE ARE ONLY ABOUT ONE
QUARTER OF THE WAY THROUGH THE MONTH. HEAVY RAINFALL IS VERY
POSSIBLE AS WE HEAD INTO MOTHERS DAY WEEKEND AND COULD PUSH RAINFALL
AMOUNTS UP ANOTHER INCH OR TWO.

THE AVERAGE PRECIPITATION FOR THE MONTH OF MAY AT THE JACKSON
WEATHER OFFICE IS 4.92 INCHES. WE HAVE ALL READY RECORDED 4.12
INCHES OF RAINFALL AS OF THIS MORNING AT 7AM. IT IS TOO EARLY TO TELL
...BUT WE ARE CERTAINLY ON TRACK TO HAVE ONE OF THE RAINIEST MAYS
EVER. THE RAINIEST MAY OCCURRED IN 2004 WHEN THE JACKSON WEATHER
OFFICE RECORDED 10.78 INCHES FOR THE MONTH. THIS WAS THE ONLY MONTH
OF MAY THAT OVER TEN INCHES OF RAIN FELL. MAY OF 1995 HAD 9.91
INCHES AND WAS THE ONLY MONTH WITH OVER 9 INCHES RECORDED. THE NEXT
HIGHEST TOTALS WERE OVER 7 INCHES AND THAT OCCURRED IN ONLY TWO
YEARS...1983 AND 1984.

HERE ARE RAINFALL TOTALS FROM EASTERN KENTUCKY COOPERATIVE WEATHER
STATIONS AND AUTOMATED SURFACE OBSERVING SYSTEMS AS OF 7 AM
EDT...FOR THE MONTH OF MAY 2009.

LOCATION         /   COUNTY     /     PRECIPITATION

BARBOURVILLE         KNOX              4.38  INCHES
BAXTER               HARLAN            3.85  INCHES
BEATTYVILLE 4N       LEE               3.68  INCHES
BIG SHELBY           PIKE              3.01  INCHES
BOONEVILLE 1SE       OWSLEY            4.49  INCHES
BUCKHORN LAKE        PERRY             2.80  INCHES
CARR CREEK LAKE      KNOTT             2.73  INCHES
CAVE RUN LAKE        ROWAN             2.28  INCHES
CLAY CITY 1WNW       POWELL            2.77  INCHES
CLOSPLINT 4ESE       HARLAN            4.55  INCHES
COLO                 PULASKI           3.98  INCHES
CRESSY               ESTILL            2.59  INCHES
DRAFFIN              PIKE              3.54  INCHES
EZEL                 MORGAN            3.31  INCHES
GIMLET               ELLIOTT           2.60  INCHES
HARLAN 1S            HARLAN            3.80  INCHES
HARLAN STATE POLICE  HARLAN            2.95  INCHES
HAZARD WATER         PERRY             3.71  INCHES
HAZARD               PERRY             3.70  INCHES
HAZARD STATE POLICE  PERRY             2.95  INCHES
HEIDELBERG 2N        LEE               4.05  INCHES
BAXTER               HARLAN            3.85  INCHES
INEZ 2E              MARTIN            3.78  INCHES
ISLAND CITY          OWSLEY            5.16  INCHES
IVEL                 FLOYD             2.27  INCHES
NWS JACKSON          BREATHITT         4.12  INCHES
JEREMIAH 1S          LETCHER           3.11  INCHES
KINGDOM COME ST PARK HARLAN            3.12  INCHES
LONDON CORBIN APT    LAUREL            4.46  INCHES
MONTICELLO 3NE       WAYNE             4.00  INCHES
MOUNT STERLING 5N    MONTGOMERY        2.41  INCHES
MOUNT VERNON         ROCKCASTLE        2.77  INCHES
ONEIDA               CLAY              4.54  INCHES
PAINTSVILLE 1E       JOHNSON           3.55  INCHES
PIKEVILLE ST POLICE  PIKE              2.05  INCHES
PRESTONSBURG 3NW     FLOYD             4.09  INCHES
QUICKSAND            BREATHITT         3.52  INCHES
RELIEF               MORGAN            3.18  INCHES
ROGERS               WOLFE             2.82  INCHES
SALYERSVILLE         MAGOFFIN          4.28  INCHES
SANDY HOOK           ELLIOTT           2.67  INCHES
SKYLINE              LETCHER           3.20  INCHES
SLADE 5NE            POWELL            2.86  INCHES
SOMERSET 2N          PULASKI           3.74  INCHES
STANTON 2W           POWELL            2.88  INCHES
STEARNS 2S           MCCREARY          5.09  INCHES
VICTORY 5NW          LAUREL            4.13  INCHES
WEST LIBERTY 3NW     MORGAN            2.67  INCHES
WEST LIBERTY 11NW    MORGAN            2.57  INCHES
WHITESBURG           LETCHER           2.50  INCHES
WHITESBURG 2SE       LETCHER           3.21  INCHES
WILLIAMSBURG 1NW     WHITLEY           5.14  INCHES

THE NATIONAL WEATHER SERVICE AT JACKSON WOULD LIKE TO THANK ALL THE
DEDICATED COOPERATIVE WEATHER OBSERVERS FOR THEIR TIMELY REPORTS."
0

Your Cart