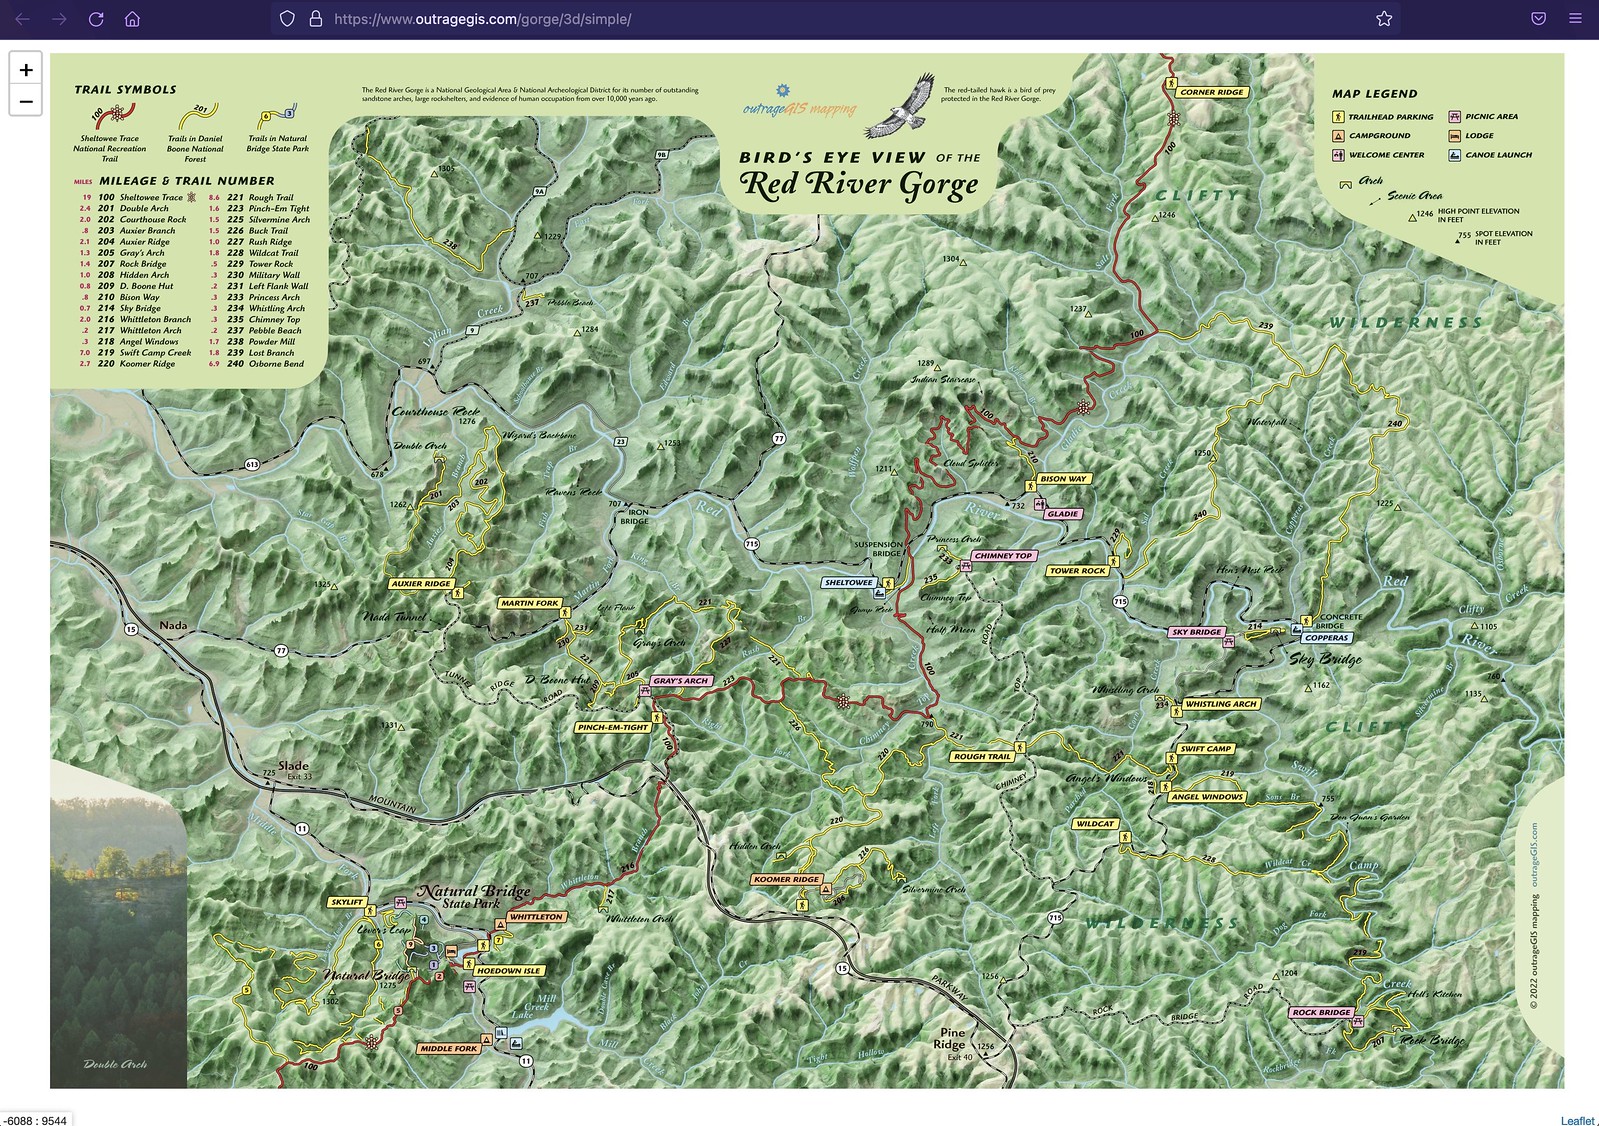
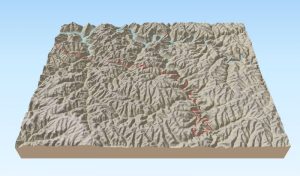
New images and data from GOES-16

Visit the page to view and download imagery

Over Christmas break, it was time to automate collecting and displaying the incredibly detailed imagery from the GOES-16 Advanced Baseline Imager. A problem that plagued previous efforts was not accessing the raw data, a netCDF formatted file for the contiguous U.S. which can be downloaded freely from a variety of cloud data hosts. With the raw data, one can project, modify and use it in web mapping libraries like Leaflet.

This page offers a slippy map of grayscale and color imagery and is updated every 15 minutes. You can download GeoTIFFs of rendered layers that can be used in GIS applications.

Arches mapping project

During the Fall 2018 semester, students mapped and visited arches and waterfalls in Kentucky’s Red River Gorge Geological Area. They adopted an arch or waterfall and produced maps, analyses, 3D visualizations, and a web page that explores their arch. Visit the site.

Arches in the Red River Gorge

Bluegrass trails, a student mapping project

Bluegrass trails, a student mapping project

Over the course of the spring 2018 semester, UKy Geography students mapped public areas in the Kentucky Bluegrass that offered hiking, walking, or recreation to the public. They could select from one of 10 areas that offered strenuous cliff-lined hiking, sculpture garden walks, or lake-view dog parks.

tastyfreeze.github.io/bluegrass/region/

Students map Town Branch Trail

Town Branch Trail in maps

Students create many maps and a website for the soon-to-be-built Town Branch Trail during the Spring 2017 semester in the GEO 409 (Advanced Topics in GIS) in the Department of Geography, University of Kentucky. We used mainly open source GIS software QGIS and GitHub to create and publish our maps.

We used mainly open source GIS software QGIS and GitHub to create and publish our maps. For the final project, students grouped into separate teams for web page production, field GPS and photography, story production, and 3D mapping.

An interactive map of the content produced for the final project can be found in the following map:

[Read more…]

Sheltowee Trace interactive mobile map

Locate yourself on the ST

We’ve updated our map of the Sheltowee Trace on our ST site: sheltoweetrace.com/hike. The map has symbols for official recreation sites and trails for the Daniel Boone National Forest, Big South Fork National River and Recreation Area, and Cumberland Falls and Natural Bridge State Resort Parks. Of course, it has the ST and mile markers from the northern terminus.

Since we deployed this map last year, we have updated the Leaflet and MapBox JS to make the work with a GPS-enabled device as long as you have a cellular data connection. The points of interests and trails are clickable with useful travel information.

Our next goal is to fill out the map with more scenic destinations and include more photographs. Let us know if you have any suggestions.

[Read more…]

Swift Camp Creek Trail interactive 3d map

Explore a 3D view of Swift Camp Creek

Explore a 3D view of Swift Camp Creek

This interactive 3D map was built in QGIS using a add-on named QGIS2Threejs. The add-on builds the model from digital elevation model in QGIS and drapes the layers symbolized in map view over the model. It utilizes javascript to make interactive in browser.

Explore the Swift Camp Creek Trail in the Red River Gorge with this 3D map. Learn more about this trail in our hiking trail page.

Lexington’s Urban Canopy

An exploration of canopy cover measures

An exploration of canopy cover measures

How much tree canopy covers the urban service area of Lexington, Kentucky? Inspired by the Davey Resource Group’s October 2013 study of canopy cover using 2012 NAIP imagery within Lexington’s Urban Service Area, a GIS class at the University of Kentucky created a similar, though limited, evaluation. [Read more…]

Pine Mountain Canopy Tour

Canopy zipline tour mapping assignment

Canopy zipline tour mapping assignment

What wild weekend and mapping task! Boyd led an undergraduate GIS class at the University of Kentucky and endeavored to map and analyze environmental tourism assets on Pine Mountain. During discussions with Pine Mountain State Resort Park, we discovered a canopy zipline tour, one of the first in the state, was being installed in the park. [Read more…]

Town Branch Trail and Density of Healthy Canopy

Which property has the healthiest canopy?

Which property has the healthiest canopy?

Town Branch Trail is a developing shared-use trail connecting downtown Lexington with the city’s outer countryside. The exercise shows the completed and funded phases for the trail, and assesses the extent and health of trees along the trail.

Using National Agriculture Imagery Program (NAIP)  2012 imagery an NDVI (Normalized Difference Vegetation Index) was created and then shown as a ratio per parcel area. After viewing the initial results, a student said, “This is a realtor’s map!” and then quickly visited the PVA website to compare property values to its ‘green index.’

Mapping Kentucky’s Wildland Fires with Satellite Imagery

KentuckyWildfires_2012-2014Kentucky has damaging wildland fires, while also using prescribed burns to manage habitat. An unfortunate statistic tells us that most wildland fires in Kentucky are from arson.

This student lab uses MODIS Active Fire Detection products and Landsat 8 near-infrared bands to locate and analyze the largest fires between April 2012 and October 2014. I hope to get point locations of smaller fires from Kentucky Division of Forestry to compare with satellite-based observations.


Students Like Field Trips

Arboretum Woods Poster

Arboretum Woods Poster

What can students do with a smartphone, ArcMap, and a linux server? More than just have fun outside!

15 student teams from two GIS courses at the University of Kentucky mapped, measured, and photographed 603 trees in the Arboretum Woods. Each team (which adopted colorful team names) was given (approximately) an acre zone. They used common mobile devices and low-cost apps to GPS and photograph the most significant trees. 

Each team made a poster and presented them during a 2014 International GIS Day event in the Thomas Poe Cooper building on UK’s campus. It was widely attended and praised for the strength of student teams’ achievement. 

UK_Arboretum_WebMap_LinkSince students photographed each tree, we made an interactive map that shows these photos and can be used for geolocation while in the woods. Using Leaflet, GeoJSON, and a Linux server, student SWEB accounts host data that feeds this interactive map: Look at trees now!

Sheltowee Trace online map

screenshot_smallWe’ve started an online map for the Sheltowee Trace, because it keeps getting longer with each new season. This month, it is 319 miles (and some change) long.

This map is mobile compatible and will locate you on the trail if your device has GPS. Try it out and tell us what you think.

The map includes the new extension from Leatherwood Ford to Honey Creek.

http://www.SheltoweeTrace.com/hike

Johnson Highway Day Map

Click to open map

Click to open map

On September 20, 2014 a downtown Lexington neighborhood hosted a block party and potluck. Raffles were held, which indeed included some outrageGIS mapping hiking maps. This map is entirely custom and shows only sidewalks and the location of the block party. The map layers two different tile sets. The minimal aspect focuses one’s attention to pedestrian modes of travel, since block parties kick out the cars.

University of Kentucky Alumni Map

UoKy Alumni Districts

Click to view

A slippy map that shows alumni districts for the University of Kentucky. A shapefile of the districts was simplified with polygon edges snapped to align and then converted to a GeoJSON file. Tried to convert to TopoJSON with the hope to minimize file size, but unfortunately with little luck. District centroids were exported and converted to marker icons. A simple example of open source mapping.

More 3D maps

Open 3D map

Open draft of map in browser.

We’re almost finished with a 38″ x 13″ map of cabins and ziplines in Cliffview Resort. This is an unusual map, since it is a bird’s eye view with latitude and longitude as the index grid for locating cabins and other destinations. The base map is an ArcGIS terrain dataset with National Agriculture Imagery Program (NAIP) aerial photography draped over a rendered TIN surface in ArcScene. The maps was then composited and illustrated in Photoshop and Illustrator.

0

Your Cart