Winter to Spring in Satellite Images, 2014
After an unusually long and cold winter, Kentucky has finally emerged to full-blown spring weather. These five images show the clearest, cloud-free day for each month from January 1 to May 5. Snow is clearly seen in the first two months and it’s striking how defined the snow lines are, perhaps 20 miles. You could have heavy snow in Lexington, but snow free in Richmond.
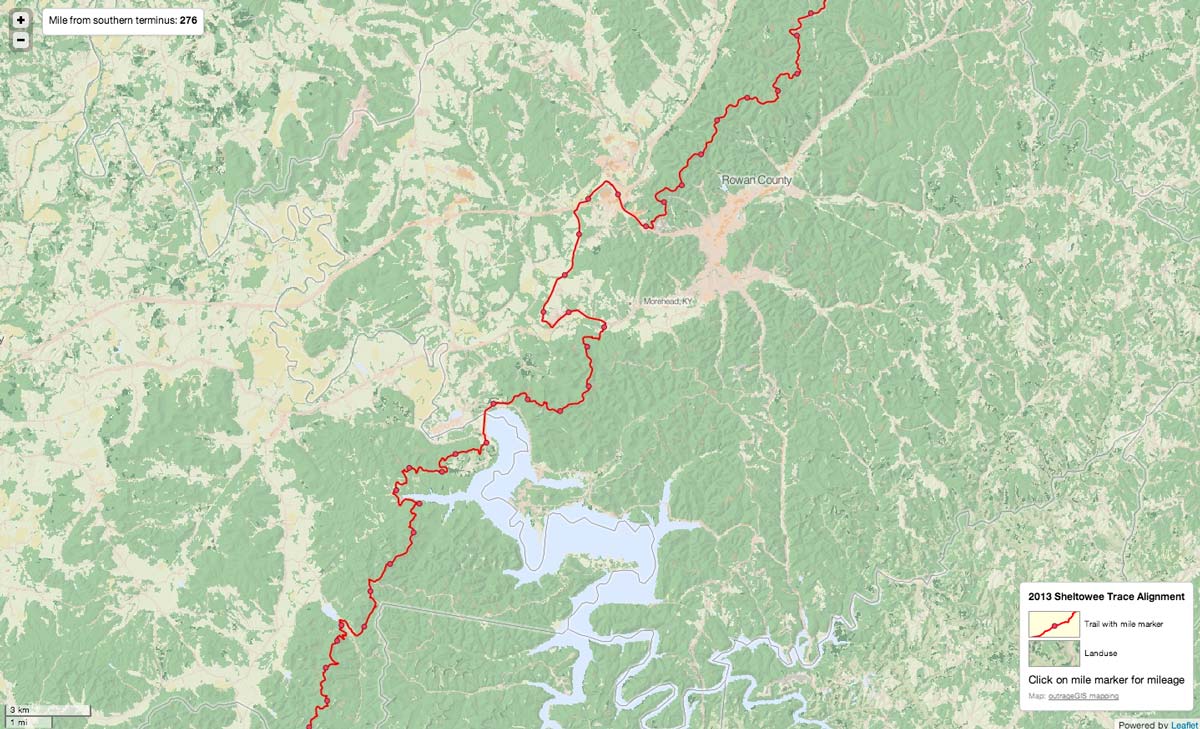
In the January image, we can see the hemlock and pine forest in the Red River Gorge and recently mined ares in eastern Kentucky. In the February image, Cave Run Lake appears frozen.
Another interesting observation is the rate pastures and forests leaf out. Kentucky’s pastures became green in early April, while the forests leaf out by the first days of May.
March is my favorite image. The sun is the highest while the vegetation is at the minimum. Â Soon, the explosion of photosynthesis will sweeten the earth with life.
No wildfires are seen (maybe one in April image in eastern Kentucky).