Tonight at 10:28 P.M. we will have our March full moon, the last full moon of winter. Full moons throughout the year have names given by early settlers and Native Americans to indicate important seasonal activities…such as a Harvest Moon and Hunter’s Moon.
The March full moon is know as a Worm Moon in the Farmer’s Almanac, for the warming of the soil and emergence of earthworms that herald the return of robins and spring. Also known as a Sap Moon for rising maple tree sap, a Lenten Moon for catholic settlers, and a Crow Moon for the cawing of crows that indicate the end of winter.
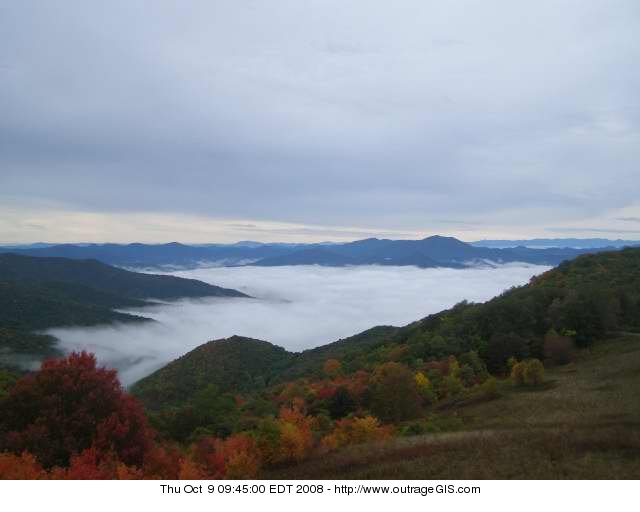
Below are photos of the moonrise above the Great Smoky Mountains. The far mountain peak the moon rises over is Mt. Le Conte.


 Pine Mountain Trail Map


