Open draft of map in browser.
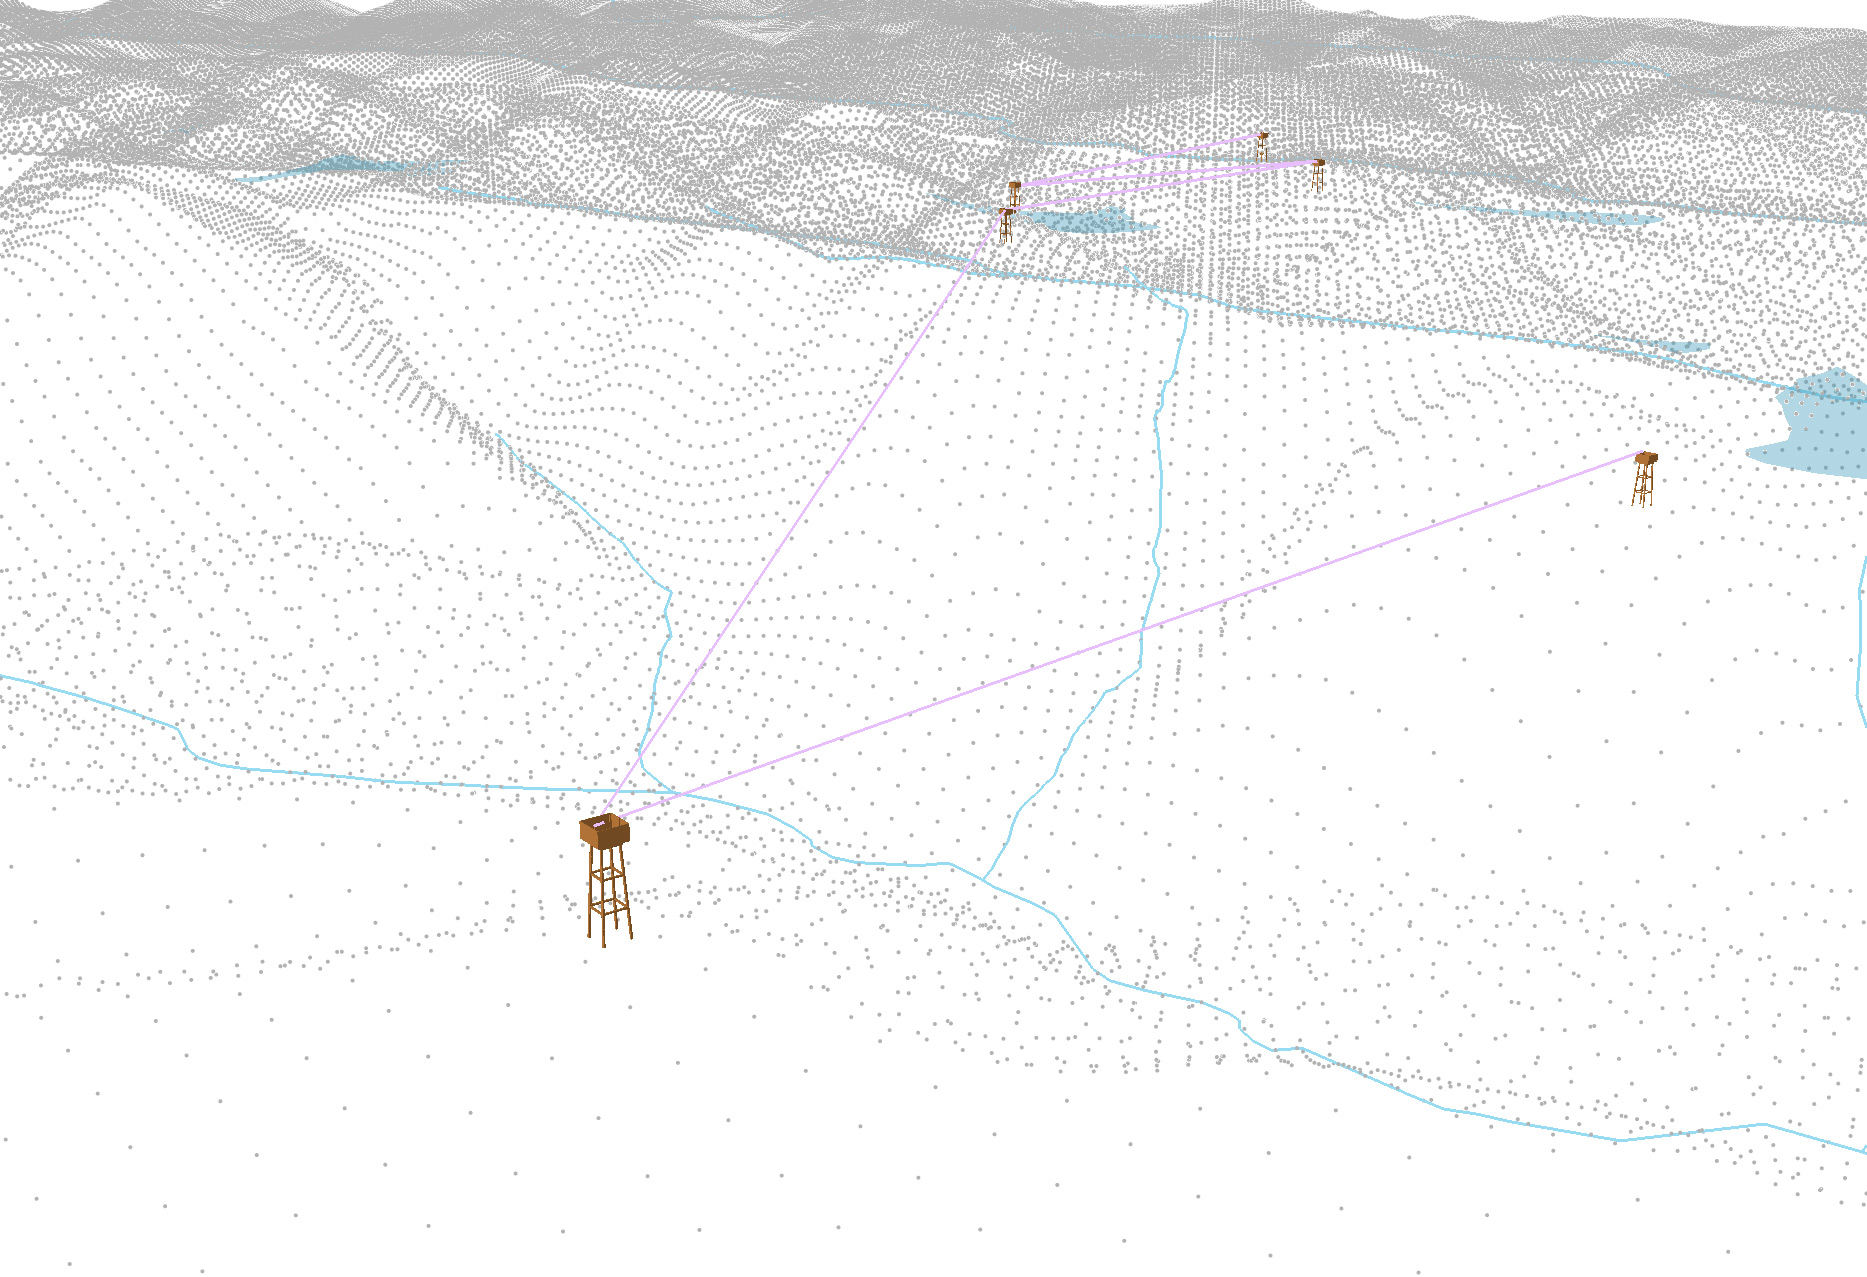
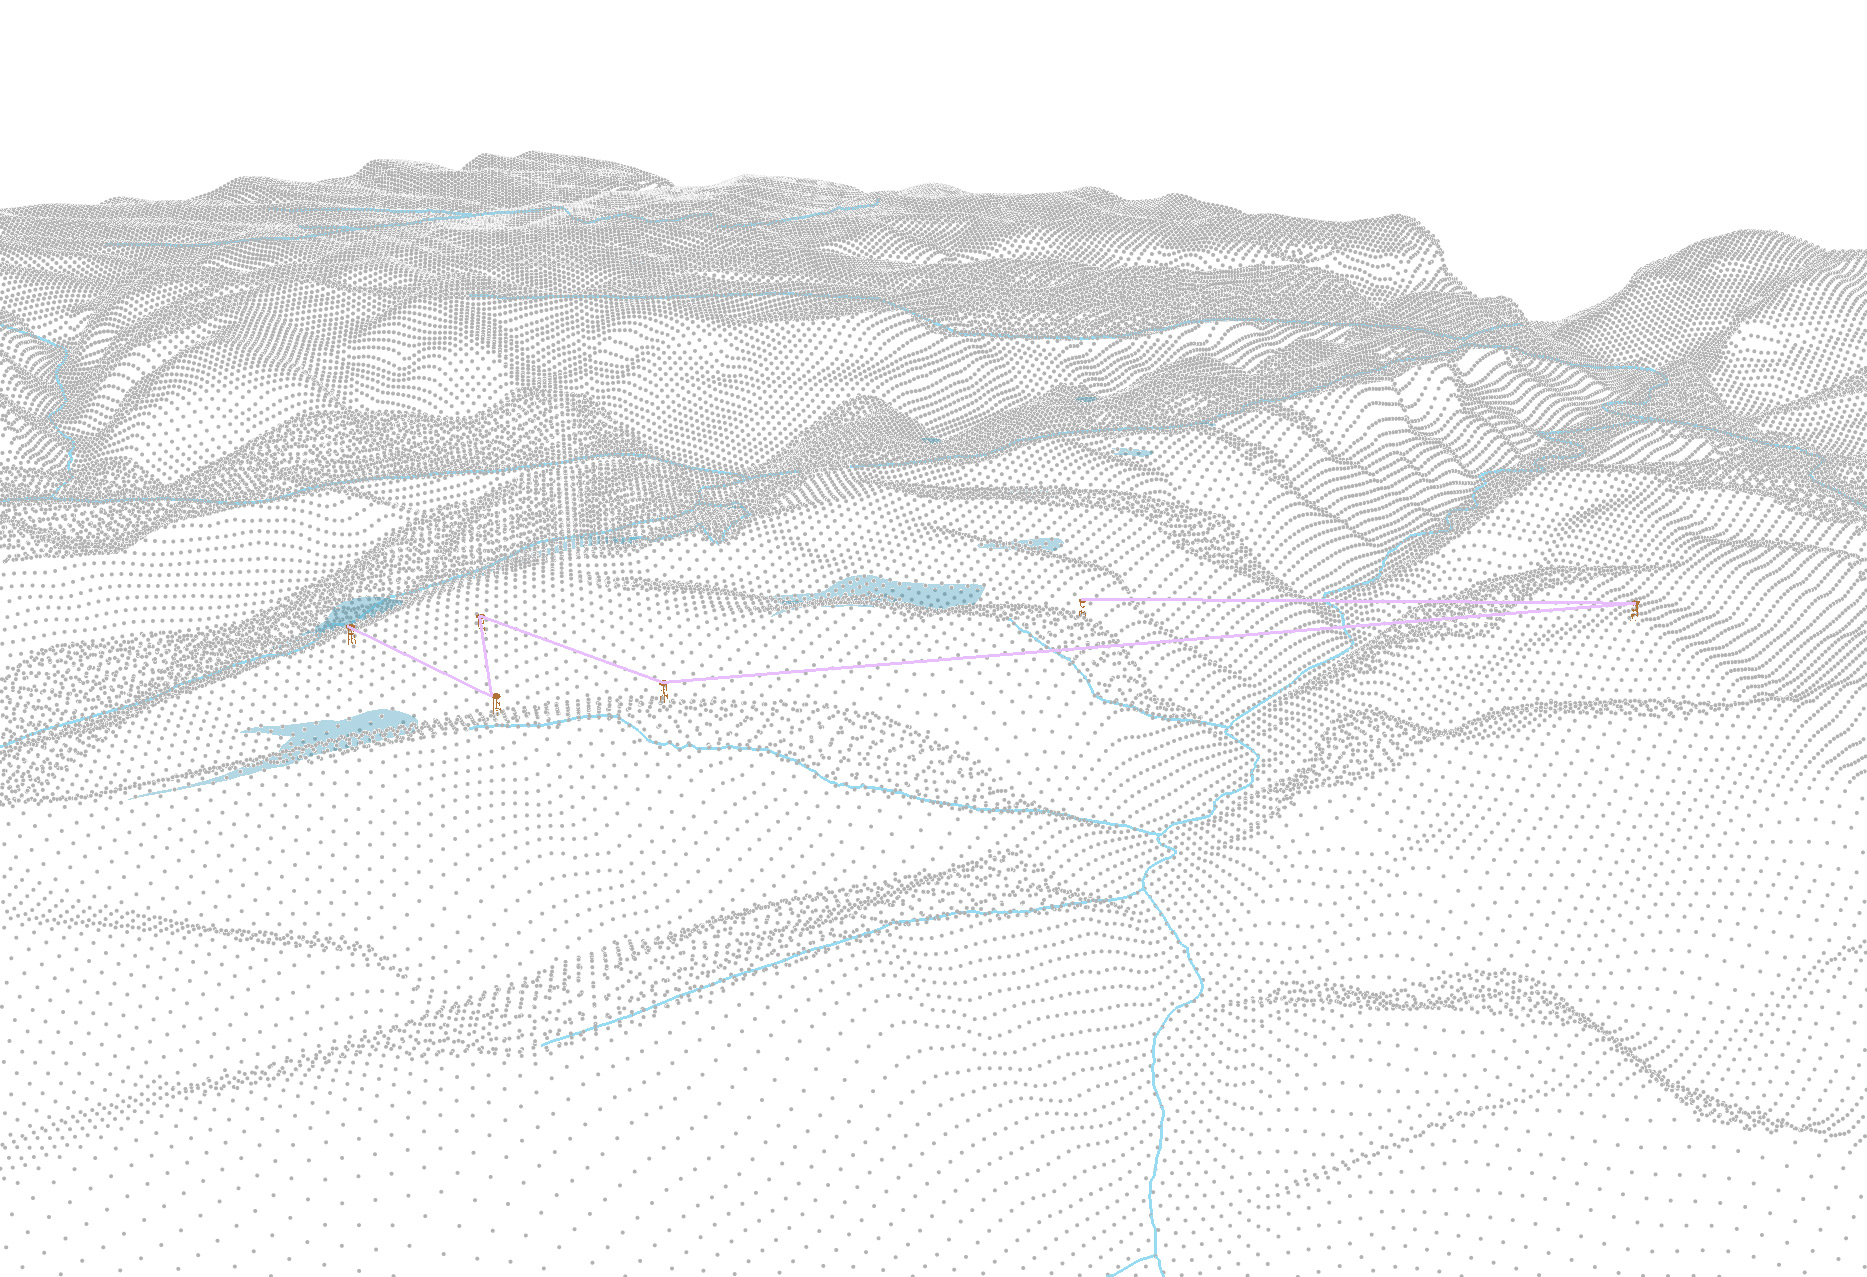
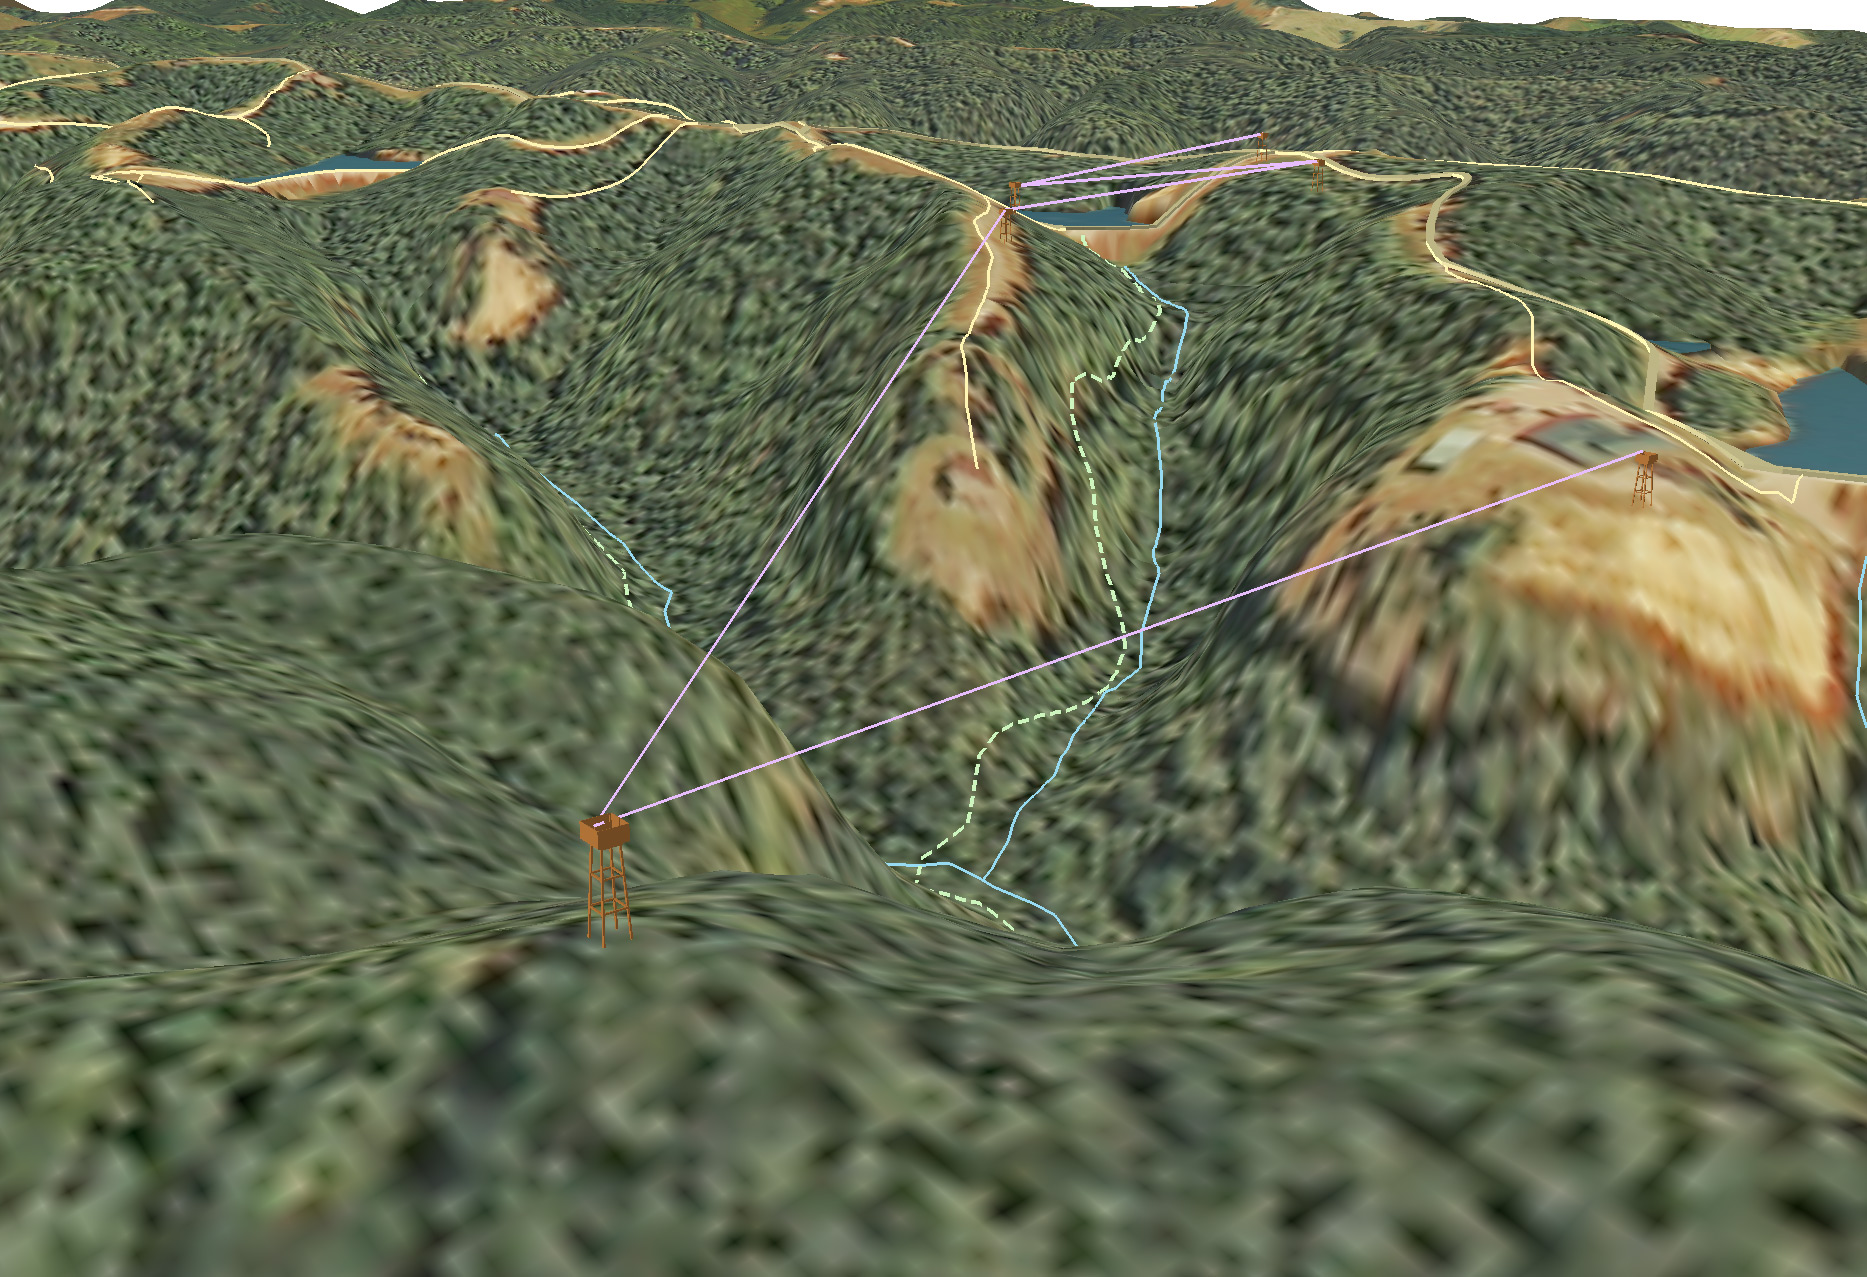
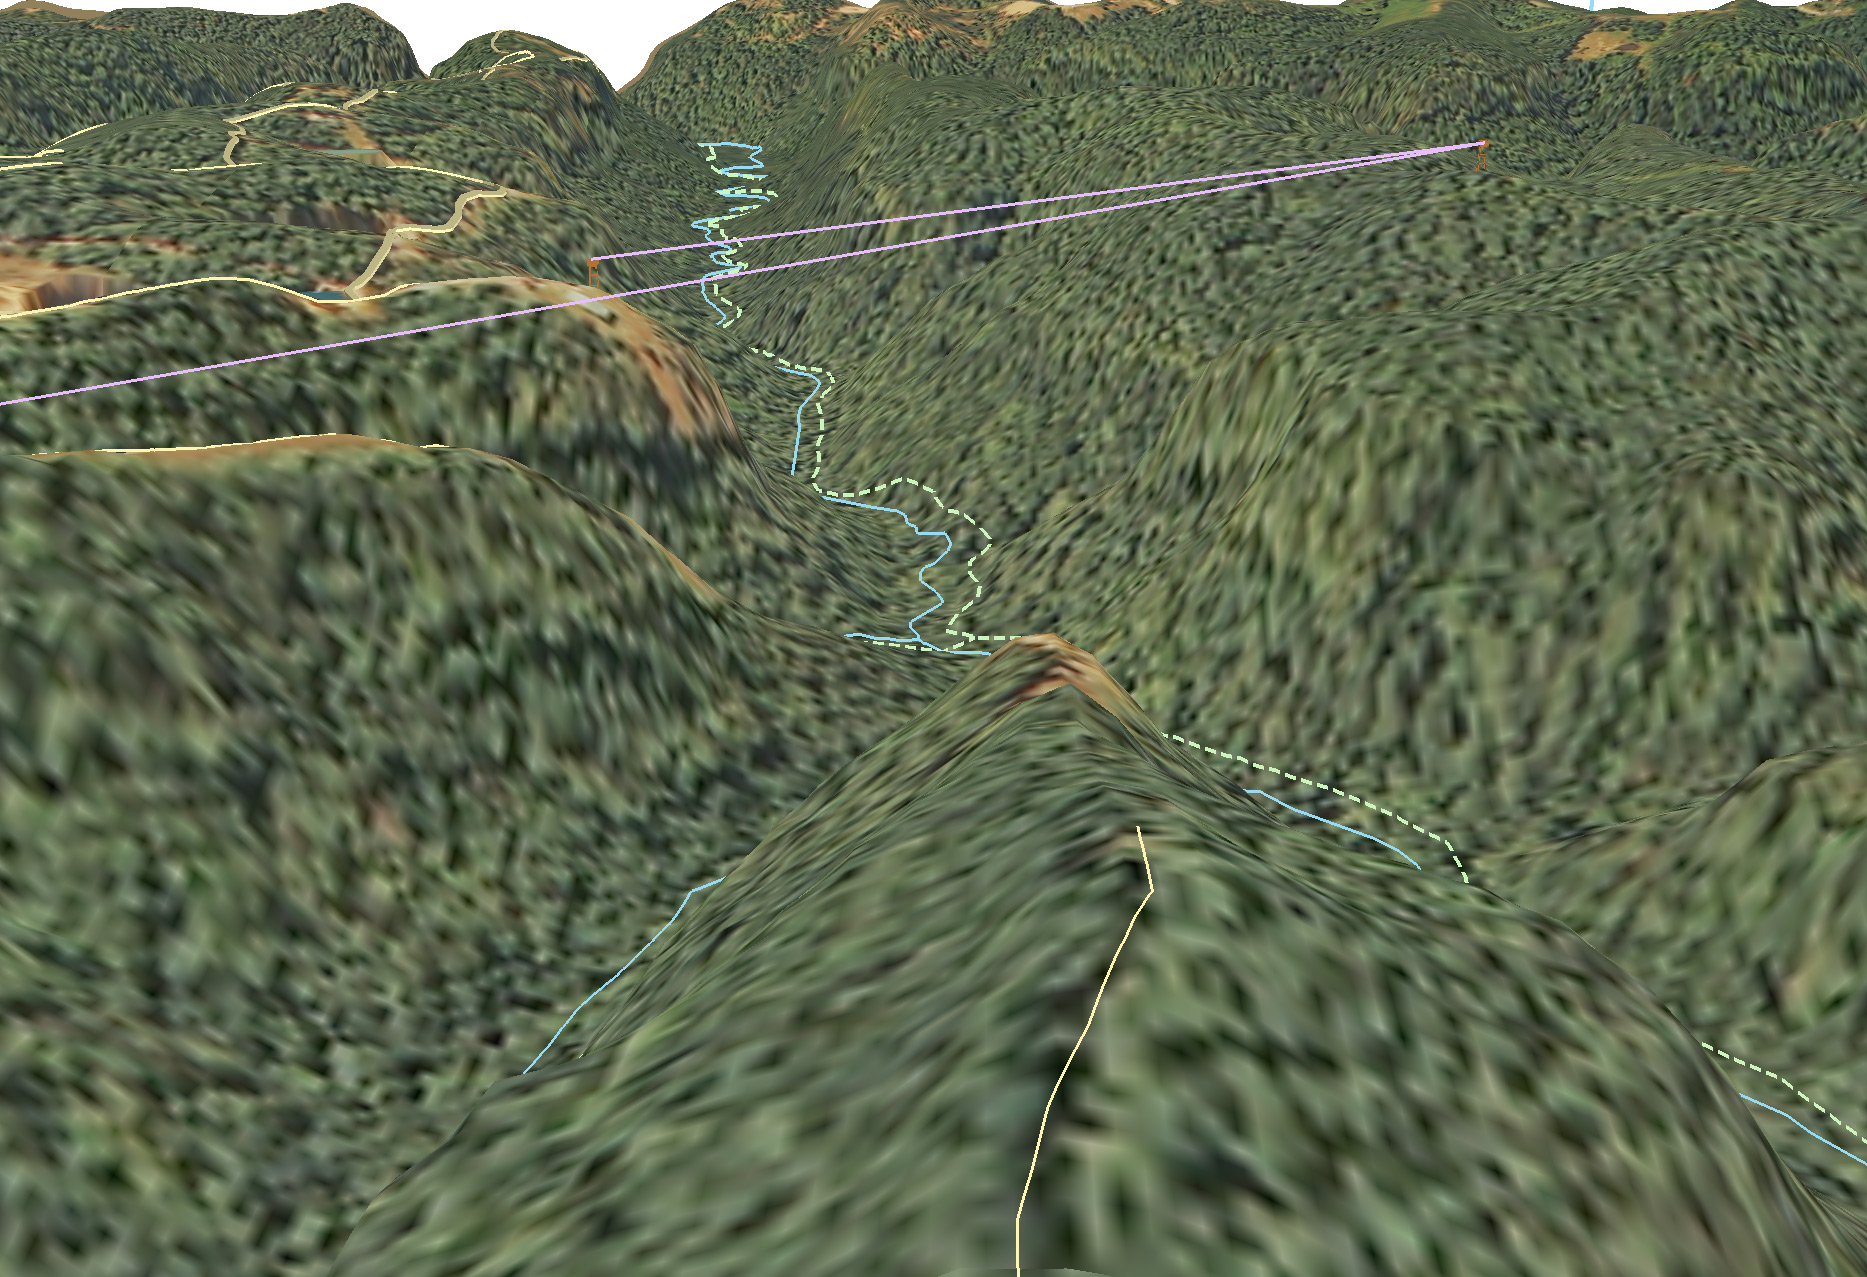
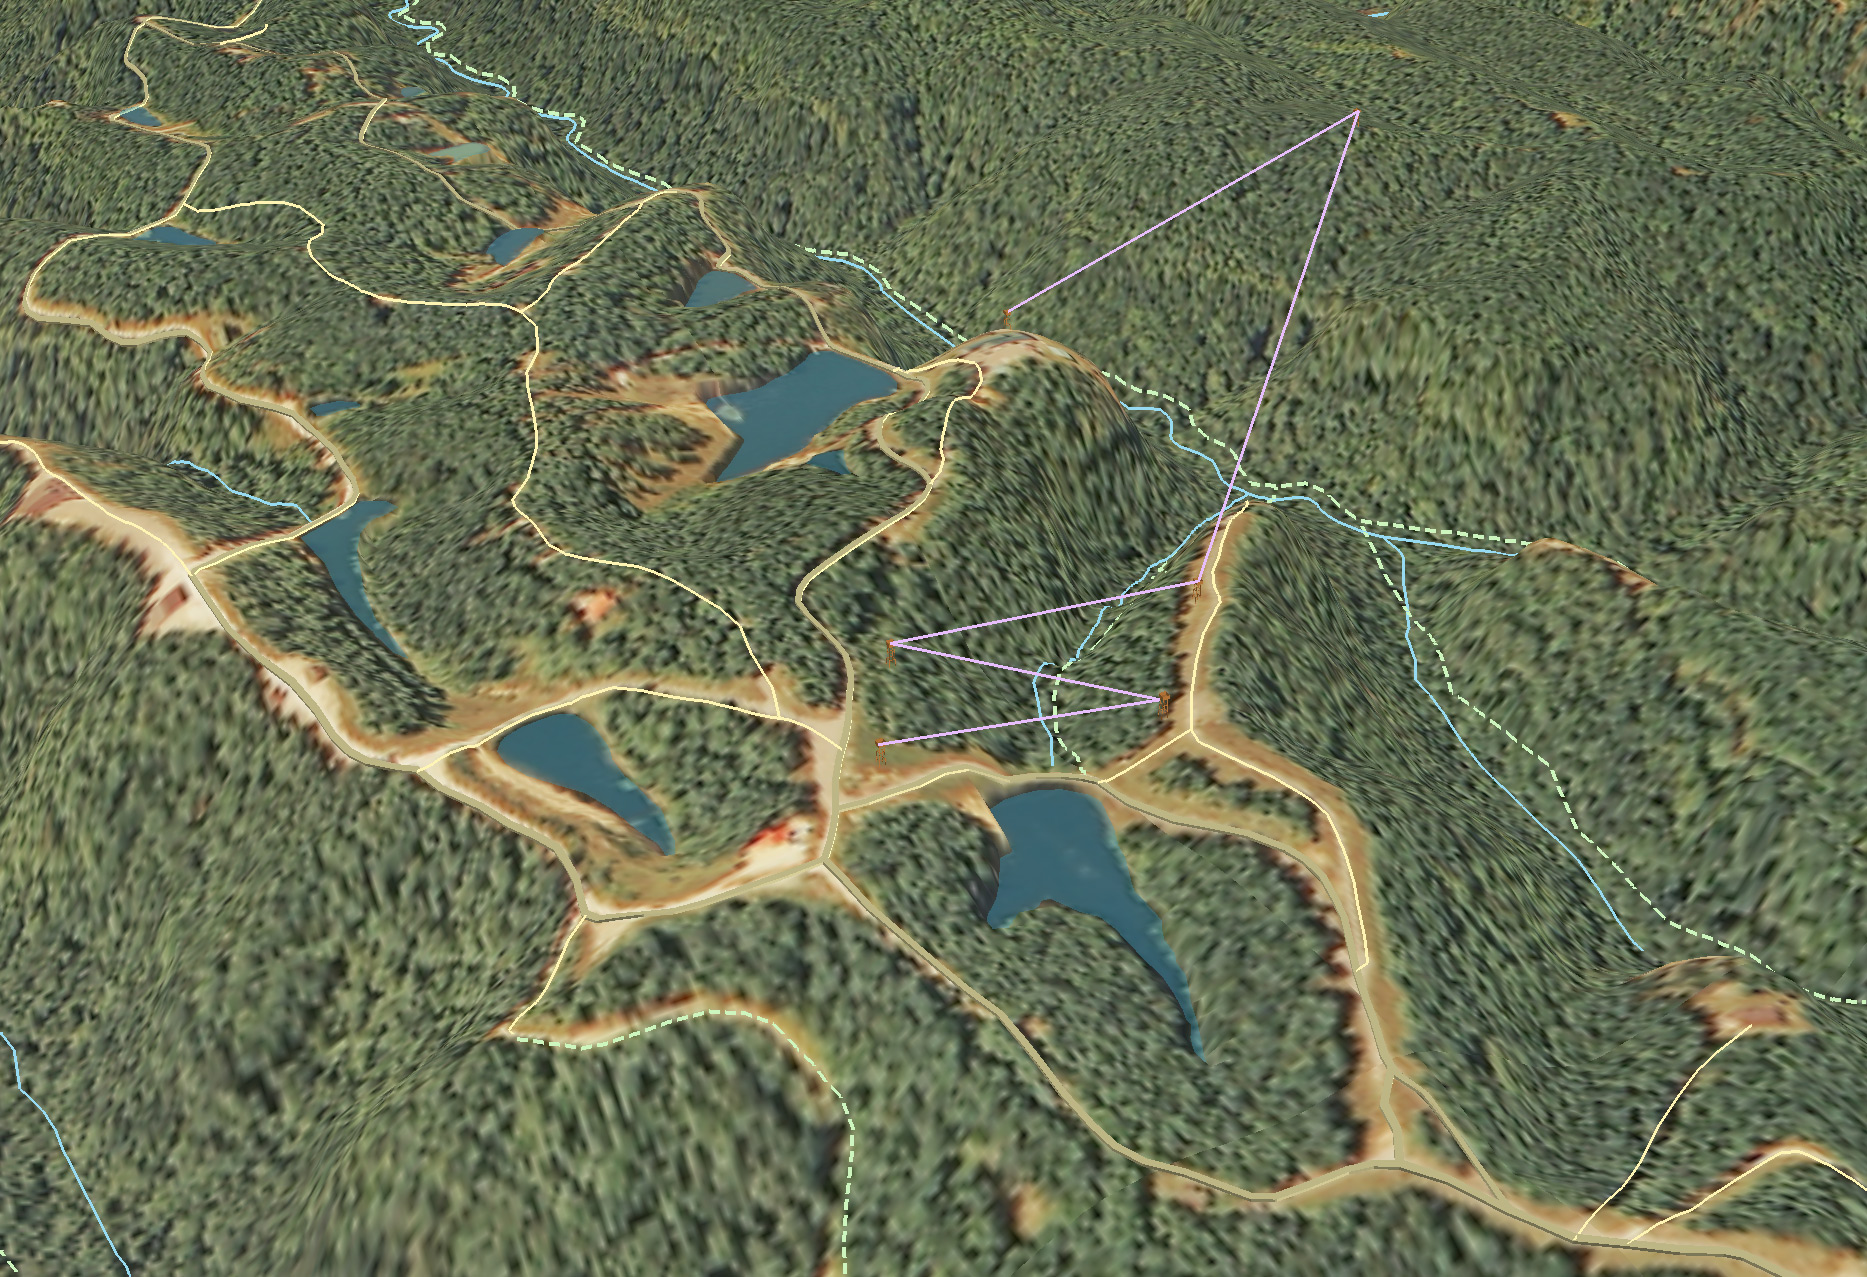
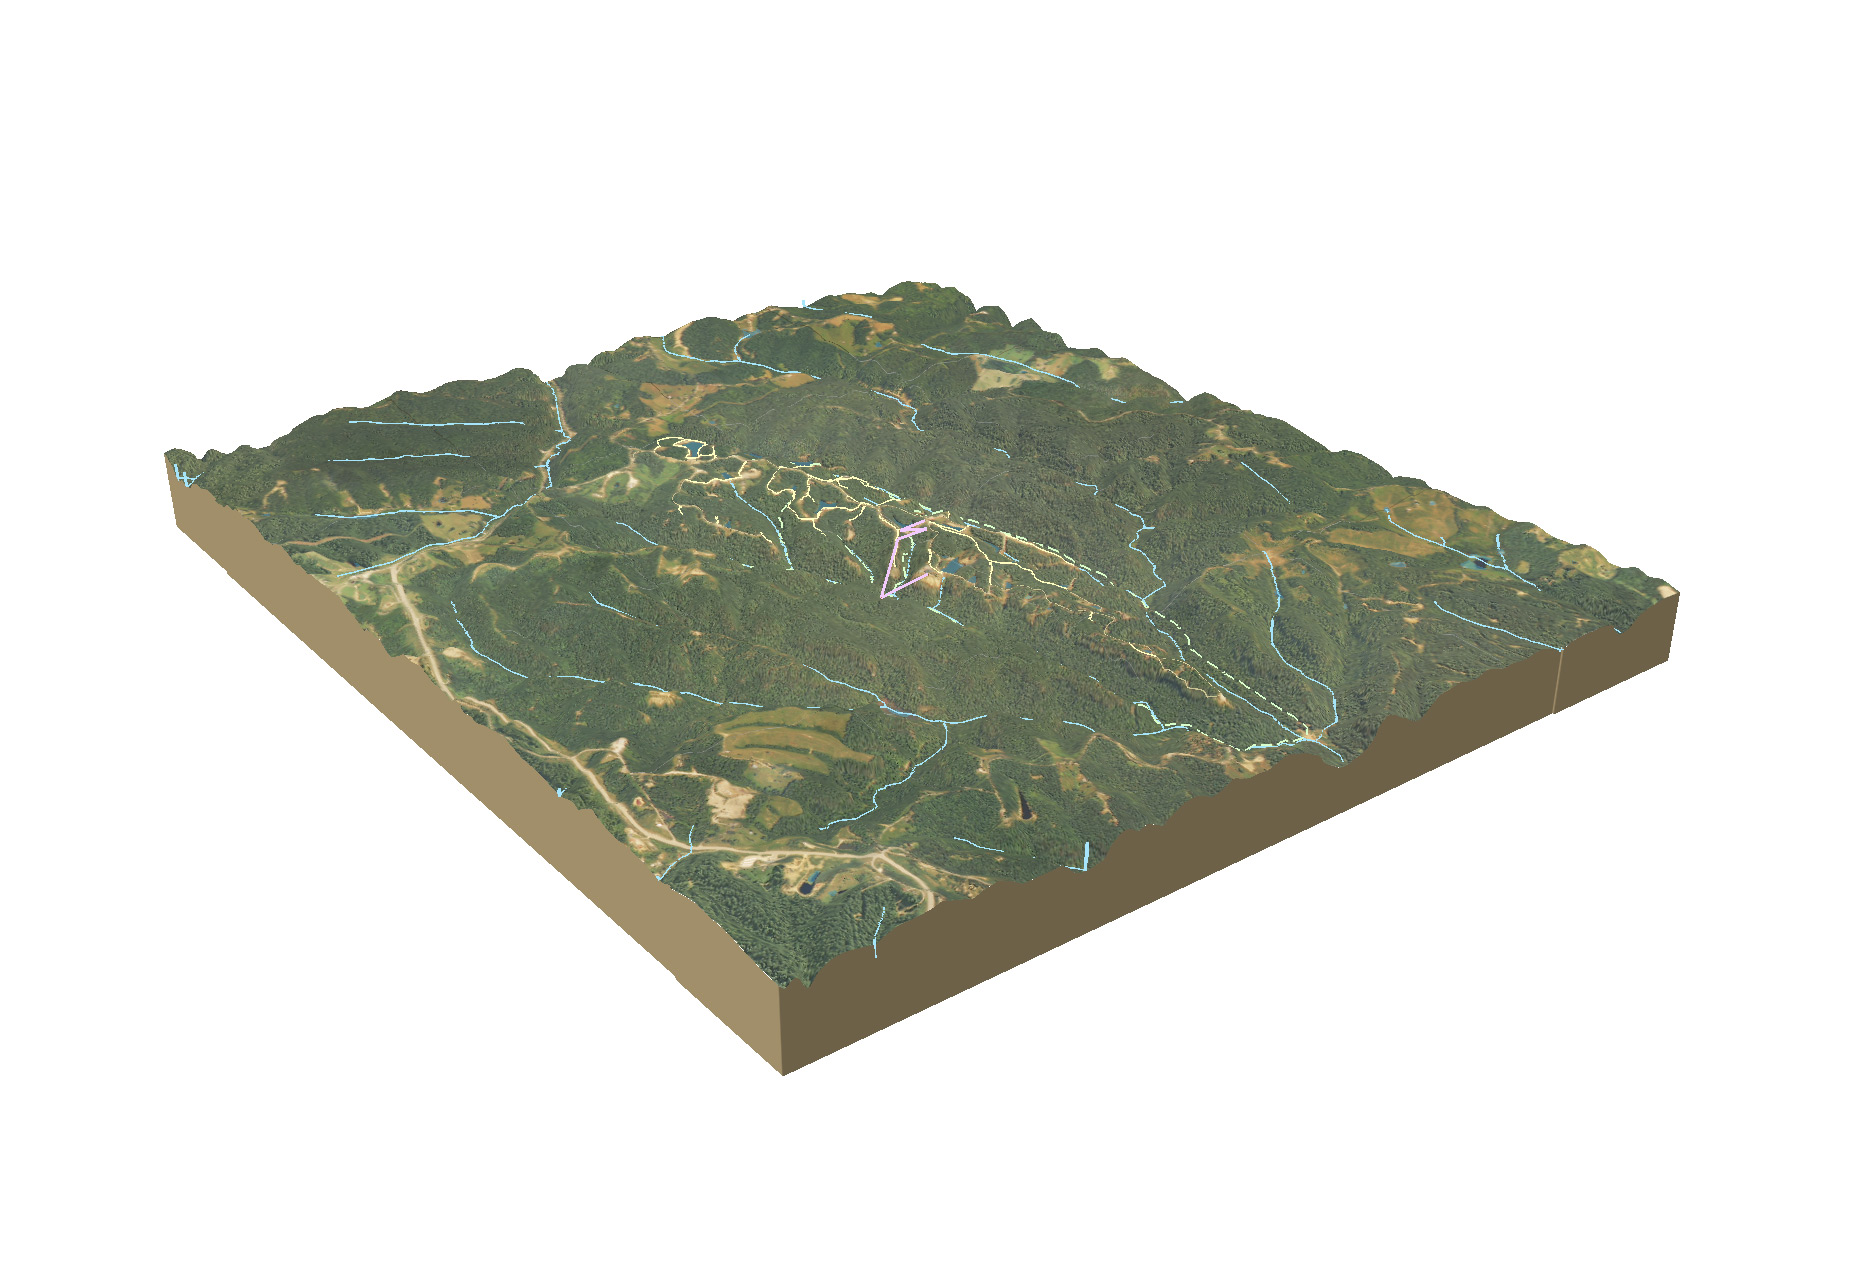
We’re almost finished with a 38″ x 13″ map of cabins and ziplines in Cliffview Resort. This is an unusual map, since it is a bird’s eye view with latitude and longitude as the index grid for locating cabins and other destinations. The base map is an ArcGIS terrain dataset with National Agriculture Imagery Program (NAIP) aerial photography draped over a rendered TIN surface in ArcScene. The maps was then composited and illustrated in Photoshop and Illustrator.